Market Terminal
Bullish Candlestick Scans: Engulfing, Harami, Morning Star and More
10 min read · Updated 2 Nov 2026
The Bullish Candlestick Scans page lists the cash-market stocks where a named bullish formation finished on the session you are looking at. The shape is already complete when it appears here - the page is not watching one build, and it is not reading an intraday chart.
This guide covers what these shapes are, the rule behind each of the five the page looks for, how the scan works on daily bars, and what every column in the table is telling you.
What is a bullish candlestick pattern?
A candlestick draws one trading session as a rectangle with two thin lines through it. The rectangle - the body - runs between the open and the close, and the lines above and below it reach to the session's high and low. Colour tells you which way round the body is: an up candle closed above where it opened, a down candle below.
A candlestick pattern is a named arrangement of one, two, three or four of those sessions in a row. The arrangements have been catalogued for centuries, and the word "bullish" in front of a name describes where tradition files the shape, not what the stock is going to do next. What the scan reports is simply that a particular arrangement of opens and closes has just occurred.
How the scan finds them
The scan runs across the NSE cash market on daily bars. For each stock it takes the last few sessions ending on the date you have chosen and asks whether any of the five formations closes out on that final bar. A shape that completed a week ago is not on today's list; it will be on the list for the day it completed, which is what the session date picker is for.
Engulfing, harami, morning star and three white soldiers are detected with the technicalindicators library - the same library that sits behind the Unfluke scanner and backtester, so a formation flagged here is the same formation those tools would recognise. The three-line strike is not in that library and is implemented directly from its standard four-candle definition.
Four controls sit above the table. The date picker chooses the session to scan and Reset returns you to the latest one. The Universe dropdown narrows the search to All, Nifty 50, Nifty Next 50, Nifty Bank or F&O stocks. Export CSV saves whatever the current tab and universe are showing.
The five formations
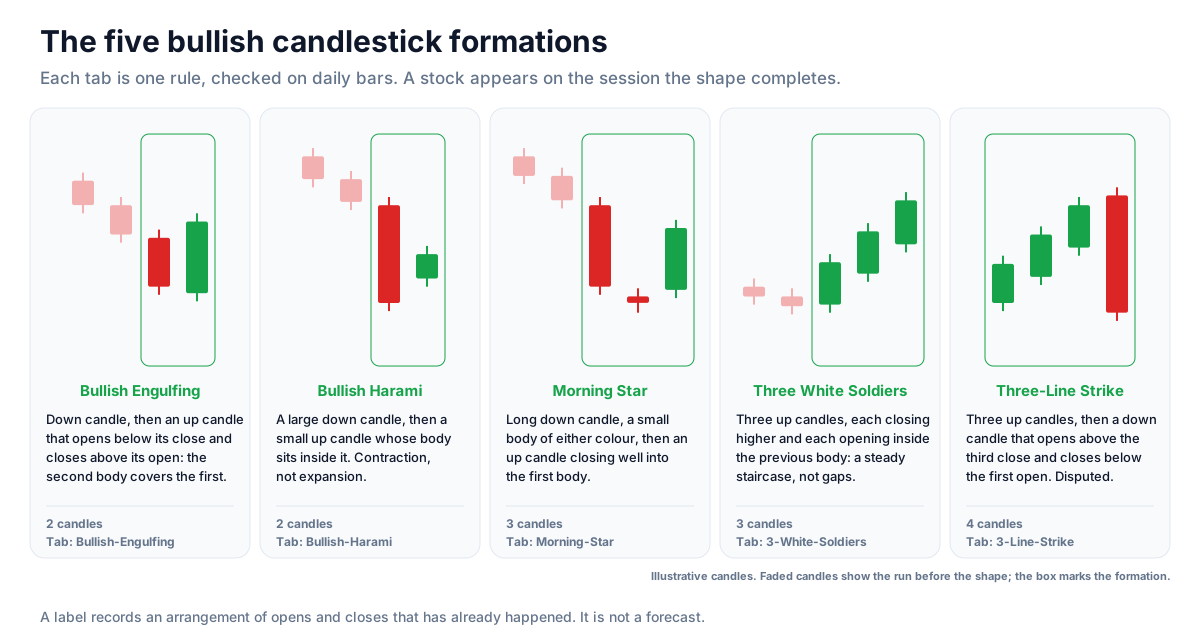
Each tab is one of these rules, and the All tab is everything the scan found on that session.
Bullish Engulfing
Two candles. The first is a down candle. The second is an up candle that opens below the first candle's close and closes above the first candle's open, so its body completely covers the body before it. The name is literal: the second body swallows the first.
Bullish Harami
Two candles again, and the reverse arrangement. A large down candle comes first, then a small up candle whose body sits entirely inside the previous body. Where engulfing is expansion, harami is contraction - the session's whole open-to-close range fits within the day before it.
Morning Star
Three candles. A long down candle, then a candle with a small body of either colour, then an up candle that closes well up into the body of the first one. The small middle candle is the part that gives the shape its name, and it is what separates a morning star from an ordinary two-day bounce.
Three White Soldiers
Three consecutive up candles, each closing higher than the one before, and each opening somewhere inside the previous candle's body rather than gapping away from it. The opening condition is what keeps this a steady staircase rather than three unrelated jumps.
Three-Line Strike
Four candles, and the odd one out on this page. Three up candles come first, each opening inside the body before it and closing beyond the previous close. The fourth candle is a down candle whose body engulfs all three - it opens above the third close and closes below the first candle's open, undoing the run in a single session.
It is catalogued as a continuation pattern, and its behaviour is genuinely disputed. Thomas Bulkowski's testing found the bearish variant behaving as a bullish reversal far more often than as a continuation, which is the opposite of what the traditional reading expects. Treat a three-line strike as a rare and interesting shape to go and look at, not as a signal with an agreed meaning.
How to read the table
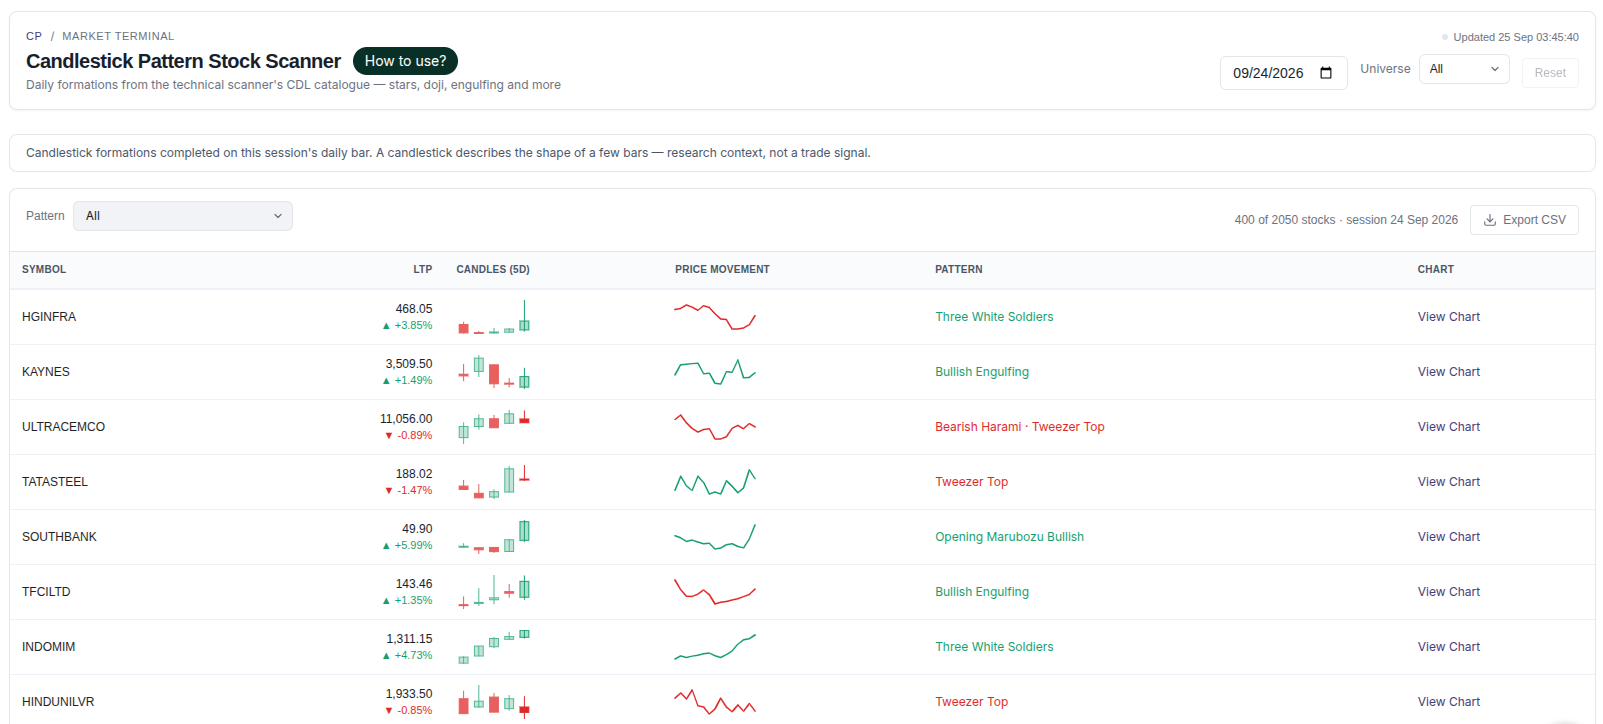
The tabs are All, Bullish-Engulfing, Bullish-Harami, Morning-Star, 3-Line-Strike and 3-White-Soldiers. The columns:
- Symbol - the NSE trading symbol.
- LTP - the close for that session, with the change and percentage change against the session before.
- Candles (5D) - the last five daily candles drawn as a miniature candlestick chart. This is the column that earns its place: the formation is a shape, and here you can see the shape instead of taking the label on trust.
- Price Movement - a line through the last 15 closes, which puts the formation in the context of the fortnight around it.
- Pattern - the formation or formations found on that session. A stock can carry more than one, because the rules overlap: a bullish engulfing on the final bar of a run of up candles can be part of three white soldiers as well.
What a candlestick cannot tell you
A formation on this page is two, three or four sessions of data. That is a very short window, and it carries no information about anything outside it - how long the stock has been falling, whether it is near a level it has respected before, what the sector did that week, whether a result or an announcement explains the whole move.
Liquidity matters as much as shape. A tidy engulfing candle in a stock that trades a few lakh rupees a day is mostly an artefact of how few trades there were, and the miniature chart will not tell you that. The Universe dropdown is the quickest guard against this: restricting to an index or to F&O names gives you a list where the bars mean something.
And a completed pattern can be undone immediately. Nothing in the rule says the next session has to do anything in particular, and plenty of them are followed by a move straight back the other way. The scan is a way of finding shapes to study, which is a different thing from a list of expectations.
Using the list for research
The practical value of the page is that it turns a manual chore - flipping through hundreds of charts looking for a shape - into a filtered list. What you do with the list is research, and a few habits make it more useful:
- Read the Candles (5D) and Price Movement columns together. The same engulfing candle means something quite different after a long slide than it does in the middle of a flat fortnight.
- Step the date picker back through a few sessions to see how often a name appears. A stock that keeps turning up is behaving differently from one that appeared once.
- Cross-check against another description of the same stock. The indicator scans and the pivot levels are built from different arithmetic, so agreement between them is worth more than either on its own.
- Export the CSV and keep it. Comparing your own records across sessions is the only honest way to form a view about how a shape behaves in the market you study, rather than adopting someone else's numbers.
Strategy ideas (ideas, not promises)
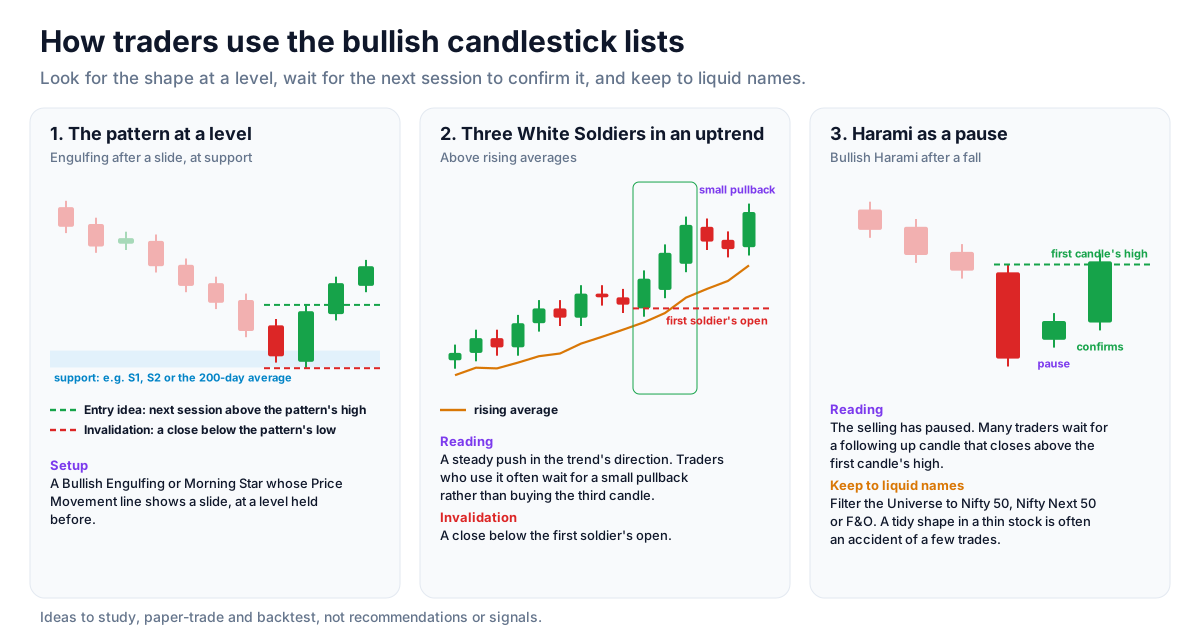
These are ideas to study, paper-trade and backtest, not recommendations or signals, and not a promise of any result. A completed shape says nothing certain about the next session, and many fail at once. Size, entries, exits and risk are your own decisions.
1. The pattern at a level
- Setup: a Bullish Engulfing or Morning Star whose Price Movement line shows it came after a slide, ideally at a level the stock has held before (an S1 or S2 on Pivots, or near its 200-day average).
- Entry idea: a move above the pattern's high in the next session, so the market confirms it.
- Invalidation: a close below the pattern's low.
2. Three White Soldiers in an uptrend
- Setup: Three White Soldiers in a stock already above its rising averages.
- Reading: a steady push in the trend's direction; traders who use it often wait for a small pullback rather than buying the third candle.
- Invalidation: a close below the first soldier's open.
3. Harami as a pause, not a signal
- Setup: a Bullish Harami after a fall.
- Reading: the selling has paused; many traders wait for a following up candle that closes above the first candle's high before acting.
4. Keep to liquid names
- Setup: filter the Universe to Nifty 50, Nifty Next 50 or F&O.
- Reading: the bars mean more where trading is heavy; a tidy shape in a thin stock is often an accident of a few trades.
How to test these
Move the date picker back through past sessions, note each formation with its high and low, and record how often the next session broke the high or the low first. Keep the CSV exports and build the record over months.
Where to go next
The mirror of this page is covered in the bearish candlestick scans guide. For shapes that span weeks rather than days, read how the chart patterns scanner works. For other ways of describing the same session, see RSI scans, Supertrend scans and pivot points and CPR explained. The Watch List guide covers the whole section. Sign up free to run the scan.
How to Read This Data
Candlestick patterns are named shapes formed by one or a few candles, such as the doji, hammer, engulfing and morning star. Each describes how the open, high, low and close of a session related to each other. The scanner lists stocks where a pattern formed.
- Read what the pattern says about the session: where it opened, where it closed and how wide the range was.
- Note where the pattern appeared, for example after a long rise or a long fall.
- Check the next candle to see whether the pattern's description held.
- Compare volume on the pattern day with the stock's usual volume.
Limitations: Candlestick names are descriptive, not predictive. A pattern can fail, especially in low-liquidity or news-driven markets.
More from the blog
- Strategy Backtesting on Unfluke
Backtest trading strategies on real Indian market data with Unfluke. Test equity, Nifty, Bank Nifty and options strategies with realistic costs and key metrics.
- Live Market Scanners
Explore Unfluke's real-time stock scanner for NSE markets. Scan 1,800+ stocks with 40+ technical indicators, fundamental filters, F&O data and custom rules.
- Option Strategy Simulator
Build and simulate multi-leg options strategies with Unfluke. Visualize payoffs, Greeks, max profit and loss, and replay historical option data from 2023.