Product
Option Strategy Simulator
11 min read · Updated 2 Nov 2026
Options are powerful - and unforgiving when you misjudge a payoff. A 1% spot move that looks survivable on a straddle can vaporise your position if implied volatility moves the wrong way. A spread that looks defined-risk on paper can have unexpected behaviour mid-expiry. The simulator is where you understand all of that before risking a rupee.
Unfluke's Option Simulator lets you build any multi-leg structure, visualise the payoff at expiry and at any intermediate date, see all the Greeks live per leg and in aggregate, and historical-replay any setup against real option chain data from 2023 onwards. This piece walks through what the simulator does and how to use it without lying to yourself about a strategy.
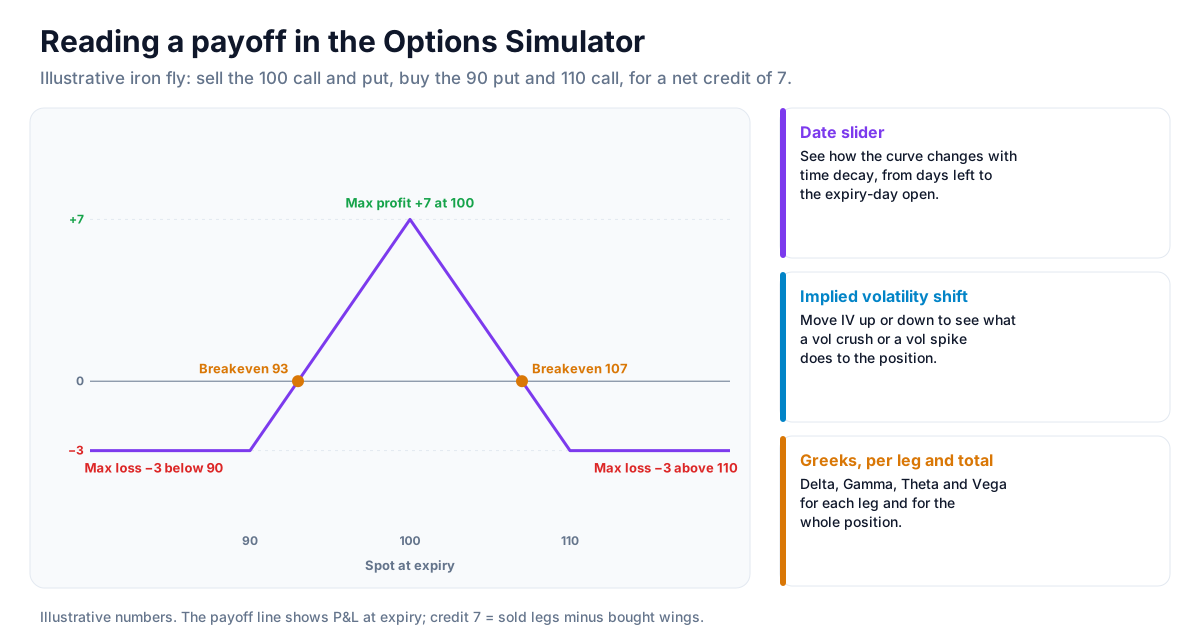
Build any multi-leg strategy
Start from a template or build from scratch. The simulator supports the entire standard menu plus custom structures up to 4 legs:
- Single-leg: long/short call, long/short put
- Volatility: straddles, strangles, butterflies, iron flies, iron condors
- Directional: bull call spread, bear put spread, bull put spread, bear call spread, ratio spreads
- Time-sensitive: calendar spreads, diagonal spreads, double calendars
- Custom: any combination of 2-4 legs with independent strikes, quantities, and buy/sell directions
See the payoff before you trade
The payoff chart shows P&L at expiry across every spot price. Drag the date slider to see how the curve evolves with time decay - what an iron fly looks like with 5 days left vs at the open of the expiry day. Shift implied volatility up or down to see what happens if vol crushes or spikes. The same chart shows your breakeven points, max profit, max loss, and the sweet-spot price range where the strategy is profitable.
Greeks - live, per-leg and aggregate
Delta, Gamma, Theta, Vega, and Rho are computed live per leg and for the whole position. The aggregate view tells you what actually matters for execution:
- Net delta - directional exposure. A net delta of +20 means the position moves like 20 long shares of the underlying.
- Net gamma - how delta changes as spot moves. Negative gamma (short premium) means delta grows against you on bigger moves. The reason short straddles can suddenly feel out of control.
- Net theta - daily decay benefit (or cost). Positive theta = you're harvesting time decay; negative theta = you're paying for time.
- Net vega - IV sensitivity. The number to watch if you're trading around events or expecting volatility regime shifts.
Historical replay against real option chain data
The simulator isn't just theoretical. Pick a past date - say a specific Thursday in May 2024 - and replay how your strategy would have performed using actual ticked option premiums from that day. No Black-Scholes synthetic estimates; real traded data. This is the bridge between "I think this strategy works in calm markets" and "here's exactly what would have happened on the day Bank Nifty moved 800 points in an afternoon".
When to use the simulator
- Understanding structure - what does an iron fly actually look like? How is a calendar different from a spread? Visual learning beats reading.
- Comparing alternatives - straddle vs strangle vs iron fly on the same underlying, same expiry, same direction view. The simulator shows the trade-offs in one picture.
- Sizing decisions - see exact max loss before you commit. Sizing on the back of a clean payoff picture is cleaner than sizing on intuition.
- Event prep - replay how a similar structure would have behaved around the last RBI policy or budget day.
- Education - explore Greeks behaviour without real-money pressure.
For learning, not execution
The simulator does not place real orders. It's deliberately a sandbox - Unfluke is broker-agnostic, so execution happens at your broker, not ours. Use the simulator to understand a strategy before going live, or to size positions on the back of a clear payoff picture. The decoupling means you can use Unfluke alongside any Indian broker (Zerodha, Upstox, Angel One, ICICI Direct, etc.) without lock-in.
Simulator vs Backtester - which to use when
Different tools for different questions. The simulator answers "what does this structure look like across spot prices and time?". The backtester answers "would this rule, run mechanically over years, have made money?". Most options traders use the simulator to design a strategy and the backtester to test whether the design works systematically. See our backtester overview for the latter.
Strategy ideas (ideas, not promises)
These are ideas to study, paper-trade and backtest, not recommendations or signals, and not a promise of any result. A payoff chart shows how a structure behaves, not where the market will go. Size, entries, exits and risk are your own decisions.
1. Compare three structures on one view
- Setup: one underlying, one expiry, one market view (for example "range-bound into expiry").
- Reading: build a straddle, a strangle and an iron fly and compare breakevens, max profit and max loss on the payoff chart.
- Use: pick the structure whose worst case you can live with, not the one with the biggest best case.
2. Stress the structure before you trade it
- Setup: a structure you already like.
- Reading: drag the date slider towards expiry and shift implied volatility up and down; watch how the curve and the Greeks change.
- Invalidation: if a modest IV spike or one day of time turns the trade into a loss you would not accept, the structure does not fit the view.
3. Replay an event day
- Setup: a recent RBI policy or budget day.
- Reading: use historical replay to see how the same structure behaved against the real option chain that day.
4. Hand the design to the backtester
Once the simulator shows a structure that matches your view, run the same legs mechanically in the backtester to see whether the design has held up over many expiries, not just one picture.
How to test these
Write down the structure, the view and the exit before you open the simulator, then backtest that exact rule over past expiries on Unfluke before risking money.
Honest caveats
A simulator shows theoretical and historical behaviour. It cannot model live broker freezes during high-IV events, your emotional discipline when 30 minutes from expiry, or fat-finger errors during execution. Most retail options losses don't come from misunderstanding the payoff - they come from execution slippage and discipline failures at the wrong moment. The simulator helps with the first problem; the others are on you. Options trading carries the risk of substantial losses. Past performance does not guarantee future returns.
Where to go next
For options backtesting (different tool, different question), see How to Backtest an Options Trading Strategy and Options Backtesting Platform. For index-specific strategy walkthroughs, see Bank Nifty Backtesting. Or jump straight in and sign up free to build your first multi-leg strategy.
More from the blog
- Strategy Backtesting on Unfluke
Backtest trading strategies on real Indian market data with Unfluke. Test equity, Nifty, Bank Nifty and options strategies with realistic costs and key metrics.
- Live Market Scanners
Explore Unfluke's real-time stock scanner for NSE markets. Scan 1,800+ stocks with 40+ technical indicators, fundamental filters, F&O data and custom rules.
- Unfluke AI - Your Trading Assistant
Use Unfluke AI as your trading assistant for stock research, scanners, strategy building and backtesting. Ask questions in plain English using Indian market data.