Crypto
Crypto Breaker Blocks: When an Order Block Fails and Flips
10 min read · Updated 9 Nov 2026
Not every order block holds. When a daily close goes straight through one, SMC flips it: a broken bullish block becomes resistance, a broken bearish block support. That flipped zone is a breaker block.
The crypto Breaker Blocks page lists the breakers that flipped today and the first return to one, and marks the "unicorn", a breaker that overlaps a fair value gap. This guide reads a BTCUSDT unicorn from September 2026 that worked, an ETHUSDT breaker from November that lasted one day, and 30 October, when eight supports flipped at once.
How a block becomes a breaker
- A bullish order block broken by a close below its low becomes a bearish breaker (resistance).
- A bearish order block broken by a close above its high becomes a bullish breaker (support).
- The zone keeps the original candle's high and low.
- The SMC logic: traders who sold (or bought) the original block are trapped and use the return to get out, which pushes price away again.
- Unicorn - a breaker that overlaps an unfilled fair value gap of the same direction, formed from two days before the flip onwards: two SMC reasons for one zone.
- A breaker that is itself closed through is finished; the page stops listing it.
Worked examples: one that held, one that failed
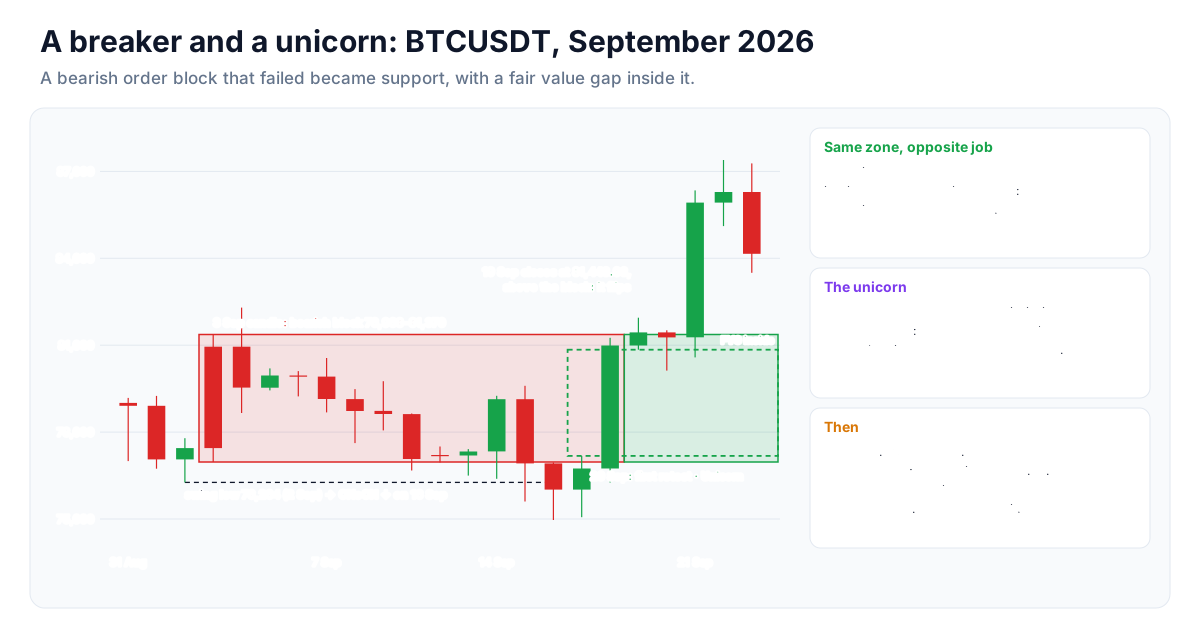
BTCUSDT, 19–22 September 2026: a unicorn that held
- On 16 September a close below the 76,264 swing low (a bearish CHoCH) left a bearish order block in the 3 September up candle: 76,968 to 81,370.33.
- On 19 September BTCUSDT closed at 81,443.93, above the block's high: the block failed and flipped into a bullish breaker (New Bullish). The same move left a bullish fair value gap, 77,179.47 to 80,844.58, inside the zone, so the row was a unicorn.
- On 20 September price traded back into the zone for the first time (low 80,126.04) and closed at 81,271.20, above it: Retest Bullish and Unicorn.
- 21 September closed 5.7% higher at 85,923.02, a bullish CHoCH; 22 September reached 87,395.67.
The breaker stayed intact for six weeks, until the 30 October close of 76,918.91 went below 76,968.
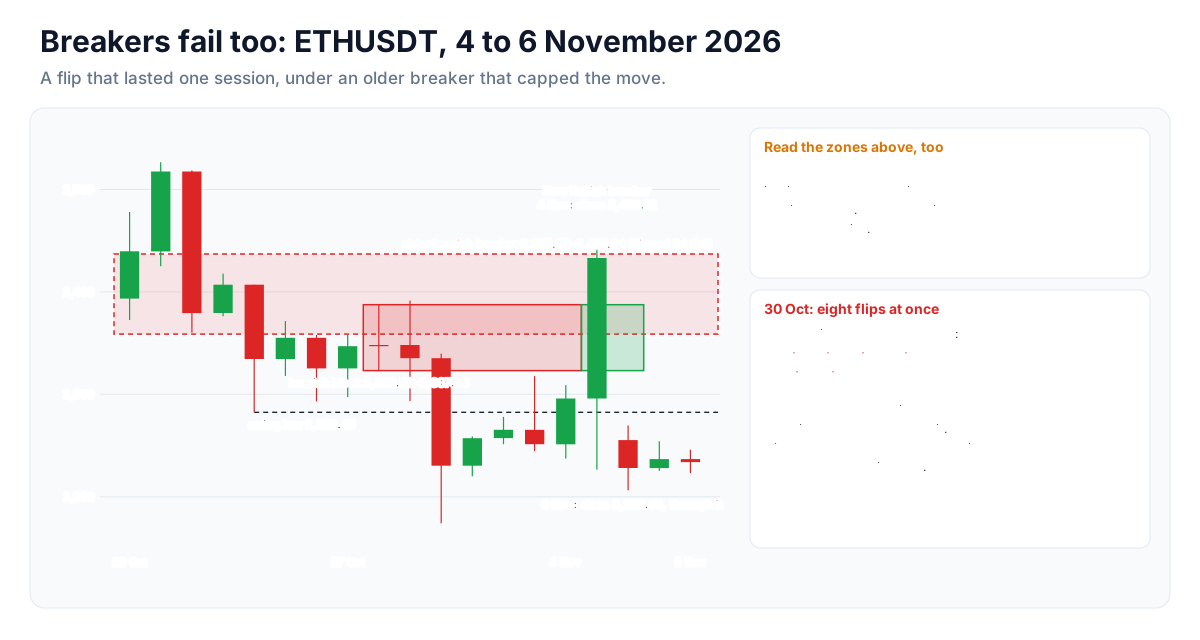
ETHUSDT, 4–6 November 2026: a flip that lasted one day
- On 30 October ETHUSDT closed below its 2,282.46 swing low, leaving a bearish block in the 28 October candle: 2,323.20 to 2,387.50.
- On 4 November it closed at 2,433.12, above the block: a New Bullish breaker.
- But 4 November's high of 2,450 had stopped inside an older bearish breaker at 2,358.88 to 2,437.04 (a bullish block from 16 September that broke on 24 October).
- The next candle, 6 November, closed at 2,228.05, through the new breaker. It was never listed as a retest; it was gone.
30 October: eight flips at once
On the 30 October sell-off the page listed eight New Bearish breakers: BNB, SOL, XRP, NEAR, HBAR, SHIB, AXS and THETA, every one a bullish block from September that a close went through. When supports fail together across the market, the breakers are one event: start with BTC and ETH and expect the altcoins to follow them.
How to use it in a trade
- Note the flip day, then wait. A New Bullish or New Bearish row says a level failed. The first retest is the setup the page is built for.
- Look for a zone in the way. ETHUSDT's new breaker on 4 November had an older bearish breaker right above it. Open the SMC Overview to see every open zone on the pair.
- Prefer unicorns. The Unicorn tab lists retested breakers with a same-direction gap inside them, and the sort puts them first.
- Count the flips. Many New Bearish rows on one day, mostly in one direction, is a market move; check BTCUSDT before trading an altcoin's breaker.
- Judge on the daily close. A close back through the zone ends the idea; a wick does not.
Risk per trade - risk a small, fixed share of capital on any one idea. Crypto never closes, so a stop is the only exit while you sleep; with leverage, keep the liquidation price well beyond the stop. When selling options, prefer defined-risk structures (spreads, iron condors) over naked positions.
Strategy ideas (ideas, not promises)
These are ideas to study, paper-trade and backtest, not recommendations or signals, and not a promise of any result. Every condition below can fail. Crypto trades around the clock and can move sharply at any hour; leverage and options can lose more than you expect, and past behaviour says nothing certain about the next session. Size, entries, exits and risk are your own decisions.
1. The first retest of a unicorn
- Setup: a pair on the Unicorn tab, with the trend on the SMC Overview pointing the same way.
- Entry idea: a daily close away from the zone in the breaker's direction, as on 20 September.
- Invalidation: a daily close back through the zone's far side.
2. New breakers as a structure signal
- Idea: a bearish block failing upward is itself a sign that sellers lost a level. Add New Bullish pairs to a watchlist for the first retest instead of chasing the flip day.
- Check: any opposing zone just beyond the flip, like ETHUSDT's older breaker.
3. Market-wide flips, majors first
- Setup: a day like 30 October with many New Bearish breakers.
- Idea: watch BTCUSDT and ETHUSDT retest their own flipped zones; altcoin retests tend to follow the majors' result.
Test before you trade - write the rules down exactly, test them on past data (see how to backtest an options strategy and the Option Simulator, which supports crypto), then paper-trade at least 20 occurrences before committing real money. Keep a journal of every trade, including the ones you skipped.
Daily or weekly candles
Every Smart Money page has a Candles setting: Daily (the default) or Weekly. Weekly runs exactly the same rules on weekly candles built from the same IST daily bars. On crypto:
- A week is Monday 00:00 to Sunday 23:59 IST, seven daily candles: Monday's open, the week's high and low, Sunday's close, the volume added up.
- The current week is the week so far. Its candle is dated the newest day, so on a Monday it is a one-day candle; a weekly row seen mid-week can change, or drop off, by Sunday's close.
- Dates in a weekly row are the week's last day: a Sunday, or the newest day for the current week.
- Counts become weeks: a swing needs five weeks on each side, ATR 14 is fourteen weeks, and every look-back counts weeks.
- What stays daily: the liquidity filter (the newest day's turnover and volume), LTP and change, and the Vol Ratio column.
- History: the scan pages build weeks from about 400 days of daily bars, so a weekly swing or zone there is at most about a year old. The SMC Overview reads up to about three years where the archive has them (158 weeks for BTCUSDT).
A weekly idea for breakers: a weekly breaker is a weekly block that a whole week closed through. On 8 November BTCUSDT's weekly chart had one open: a bearish breaker from 98,673.66 to 108,952.38, a bullish block from June 2025 that failed in November 2025. A first weekly return to a zone like that is a level many traders watch from both sides; watch the daily candles when price reaches it.
Every tab and column
The tabs
- All - breakers that flipped today and first retests.
- Retest Bullish / Retest Bearish - the first return to the flipped zone.
- New Bullish / New Bearish - a block broken today.
- Unicorn - retested breakers overlapping a same-direction fair value gap.
The columns
- Side - the breaker's direction (bullish = support).
- Zone Low / Zone High - the original block's range.
- Block From / Flipped On - the block candle and the day it broke.
- Chart - the zone shaded, the original block and the break marked.
What the lists are built from on crypto
Which pairs are scanned
- The live USDT pairs in Unfluke's crypto archive, from BTCUSDT and ETHUSDT to mid-caps such as GRTUSDT and THETAUSDT: 33 were scanned on 8 November 2026.
- Stablecoins are left out by behaviour: a pair whose average daily range over 20 days is under 0.25% (USDCUSDT's is a few hundredths of a percent) is not scanned. A day with under US$100,000 traded is skipped as untraded.
- The liquidity filter: a 20-day average turnover above US$500,000, and the day's volume above 0.8 times its 20-day average. Crypto has no price bands, so there is no circuit check.
- The universe box: All, Futures or Options (pairs that also have a perpetual future, or options, in the archive).
Three things that are different on crypto
- A day is an IST day. Each daily candle runs from 00:00 to 23:59 IST, rolled up from the one-minute spot archive (Binance data). Another chart that closes its days at 00:00 UTC (05:30 IST) will show different candles, and so different swings and zones.
- Weekends thin the lists. The 0.8 × volume test is the same as on NSE, but crypto trades every day and volume falls away at weekends. From 10 August to 8 November 2026 an average of 21.2 pairs passed on a weekday and 10.8 on a Saturday or Sunday; BTCUSDT itself was off the lists on 27 of 89 days, 21 of them weekends. On Sunday 8 November no pair passed and every list was empty. The SMC Overview has no liquidity filter, so a pair's zones are always there.
- Missing days. The archive has no candle for 5 August, 11 September or 5 November 2026, when the feed stopped. The candles on either side sit next to each other, and a swing count of "five days" can span six calendar days there.
The newest day can also be unfinished: the feed runs about a day behind, and the newest stored day is topped up until it is complete, so its volume, and with it the liquidity test, can change during the day.
A note on Smart Money Concepts
Smart Money Concepts are a way of reading a chart, popularised by the trader known as ICT. There is no official rulebook and no published evidence that they work better than other methods, on crypto or anywhere else; the pages apply one fixed reading so a row can be checked by hand. They describe what price did, not what it will do.
Where to go next
Open the page at Smart Money → Breaker Blocks (switch the market to Crypto), or sign up free to open the Market Terminal.
The other crypto Smart Money guides: SMC Overview, Fair Value Gaps, Order Blocks, Liquidity Sweeps. The NSE version of this page, with its own worked examples, is explained in the Breaker Blocks guide. For what traders were doing in the futures market on the same days, see the OI Buildup guide and the Binance Futures guide.
More from the blog
- Strategy Backtesting on Unfluke
Backtest trading strategies on real Indian market data with Unfluke. Test equity, Nifty, Bank Nifty and options strategies with realistic costs and key metrics.
- Live Market Scanners
Explore Unfluke's real-time stock scanner for NSE markets. Scan 1,800+ stocks with 40+ technical indicators, fundamental filters, F&O data and custom rules.
- Option Strategy Simulator
Build and simulate multi-leg options strategies with Unfluke. Visualize payoffs, Greeks, max profit and loss, and replay historical option data from 2023.