Product
Fundamental Analysis Suite
11 min read · Updated 2 Nov 2026
For positional investors, the price chart is the surface - useful, but not the source of conviction. The real signal lives in the financial statements: which businesses are compounding capital efficiently, which are silently leveraging up, which are generating cash and which are reporting accounting profit without it. A serious fundamental research workflow needs depth across all of this, history going back 10+ years, and the ratio decomposition to understand why the numbers are changing.
Unfluke ships 13 dedicated fundamental modules covering the full NSE universe, with multi-year history, daily refresh, and direct integration with the fundamental scanner and AI bots. This piece walks through what's covered, how to use it, and the fundamental-research workflow that gets you to conviction without re-reading every annual report.
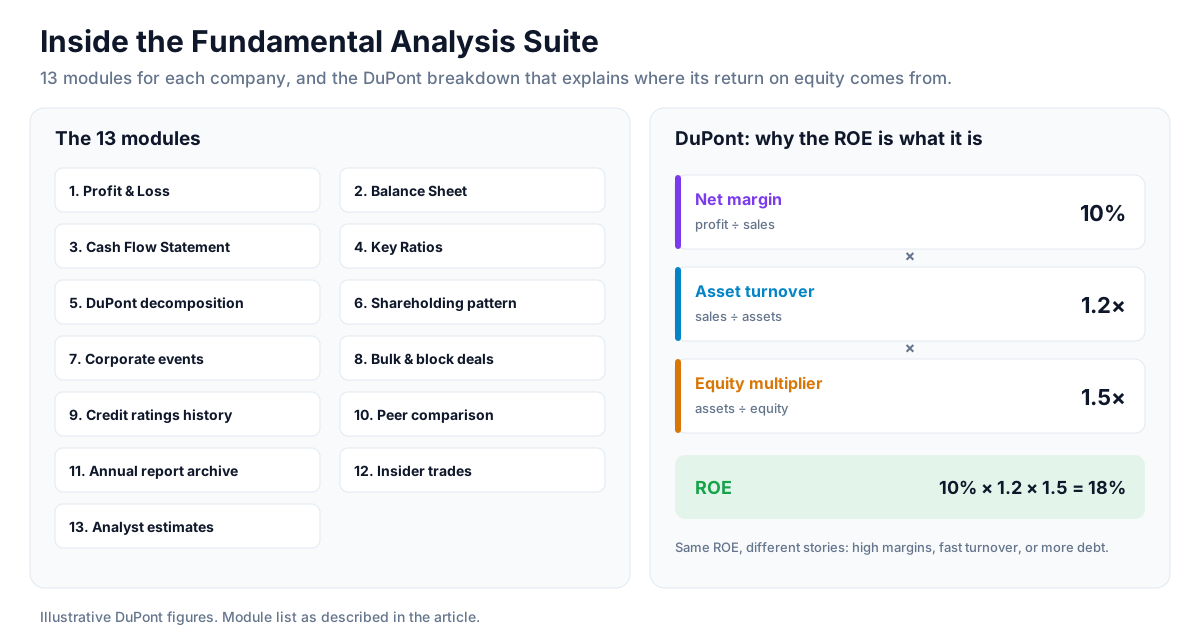
The 13 modules covered
- Profit & Loss - 10-year history, quarterly + annual, segment-level where disclosed
- Balance Sheet - multi-year, asset/liability breakdowns, leverage ratios
- Cash Flow Statement - operating, investing, financing - the most honest single statement in any company's filings
- Key Ratios - ROE, ROCE, debt-to-equity, interest cover, current ratio, gross/operating/net margins, working capital metrics
- DuPont decomposition - ROE broken into margin × asset turnover × leverage. Tells you whether returns come from efficiency, leverage, or pricing power
- Shareholding pattern - promoter / FII / DII / public splits, quarter-on-quarter, with change deltas
- Corporate events - dividends, splits, bonuses, AGMs, rights issues, buybacks
- Bulk & block deals - who's buying and selling in size
- Credit ratings history - CRISIL / ICRA / CARE / India Ratings, with trajectory
- Peer comparison - side-by-side ratio view across companies you choose
- Annual report archive - historical PDFs indexed and searchable
- Insider trades - promoter-group transactions
- Analyst estimates - consensus where available
Why 10-year history matters
One quarter's numbers tell you almost nothing. Three years tell you the recent trend. Ten years tell you whether the business has survived multiple cycles - and how it behaved during the ones it didn't grow through. A company that compounds ROE at 20% across a decade including 2020's pandemic, a banking credit shock, and a global commodity cycle has demonstrated something. One that compounds 25% across only the last 3 boom years has demonstrated very little.
DuPont - the single most useful breakdown
DuPont decomposition takes ROE - a single, easily-gamed number - and breaks it into its three drivers. Two companies can report identical 20% ROE: one earning it through pricing power and capital efficiency (high margin × high asset turnover, low leverage), the other through leverage alone (low margin, low turnover, high debt). They're not the same business. DuPont shows you the difference at a glance. Unfluke surfaces it automatically for every NSE listed name.
Cash flow - the lie detector
Reported profit can be inflated by aggressive accounting. Operating cash flow can't. A business reporting steady profit growth with stagnant or negative operating cash flow is a flag that something in working capital, receivables, or revenue recognition deserves attention. The cash flow module surfaces this alongside the P&L so divergences are visible without opening filings.
Fundamental + scanner - the unfair edge
Reading fundamentals is one thing. Filtering 1,800 stocks by fundamental criteria is another. Unfluke's fundamental scanner takes the same data layer and lets you run filters like "ROE > 18% AND P/E < 25 AND debt-to-equity < 0.5 AND 3-year sales growth > 15%". That intersection - the filter most positional investors actually want - is impossible without a unified fundamental dataset under a scanner.
Ask the AI
For traders who prefer conversational research, Unfluke's Company Fundamentals bot answers questions over this same data: "Walk me through HUL's ROE trajectory", "Compare TCS vs Infosys on growth and margins", "What's flagging on Reliance's balance sheet?". The bot pulls from the same 13 modules and returns grounded answers in 30 seconds - faster than opening Screener and an annual report.
Where the data comes from
Sourced from Capitaline - the same dataset used by institutional desks - with daily refresh after market close. Data is reconciled against NSE filings and corporate announcements; corrections roll through within 24 hours of a filing update.
Strategy ideas (ideas, not promises)
These are ideas to study, paper-trade and backtest, not recommendations or signals, and not a promise of any result. Strong financials describe a business, not when its share price will move. Size, entries, exits and risk are your own decisions.
1. Read ROE through DuPont
- Setup: for a company with a high ROE, check the DuPont split into margin, asset turnover and leverage.
- Reading: ROE driven by leverage carries more risk than ROE driven by margins or efficiency.
2. Check profit against cash flow
- Setup: compare reported profit with operating cash flow over several years.
- Reading: profit that rarely turns into cash deserves a closer look.
3. Watch shareholding shifts
- Setup: follow promoter, FII and DII holdings quarter by quarter.
- Reading: a steady change over several quarters says more than one quarter's move.
4. Feed a fundamental screen into the scanner
- Setup: combine fundamental conditions with a technical trigger in the scanner.
- Use: a shortlist of sound businesses to study, rather than a buy list.
How to test these
Build the screen on the scanner, then backtest the rule over past years to see how such stocks behaved.
Honest caveats
Fundamental analysis tells you about the past - what the business has done, what its balance sheet looks like today, how its returns compounded. It doesn't tell you the future. Excellent historical fundamentals don't guarantee future outperformance; deteriorating fundamentals don't guarantee underperformance. Use the modules to build conviction in a thesis, then size positions accordingly. The deeper your fundamental work, the more comfortable you'll be holding through normal-cycle drawdowns; that's the actual value.
Where to go next
Pair fundamental research with the scanner for screening, and the AI chatbot for fast research Q&A. Sign up free for access to the full fundamental suite on the NSE universe.
More from the blog
- Strategy Backtesting on Unfluke
Backtest trading strategies on real Indian market data with Unfluke. Test equity, Nifty, Bank Nifty and options strategies with realistic costs and key metrics.
- Live Market Scanners
Explore Unfluke's real-time stock scanner for NSE markets. Scan 1,800+ stocks with 40+ technical indicators, fundamental filters, F&O data and custom rules.
- Option Strategy Simulator
Build and simulate multi-leg options strategies with Unfluke. Visualize payoffs, Greeks, max profit and loss, and replay historical option data from 2023.