Tutorial
Trading Strategy Backtesting - A Beginner's Foundation
11 min read · Updated 2 Nov 2026
If you're new to systematic trading, "backtesting" is one of those words people use a lot without ever defining. The result is that most retail traders pick up backtesting software, run a few tests, see big numbers, and convince themselves they have an edge. They don't - they have an artifact of how they used the software.
This piece is the foundation. It covers what backtesting actually is, why it matters, the most common beginner pitfalls, and how to think about your first few backtests honestly. By the end you'll be ready to run a real test without lying to yourself about the results.
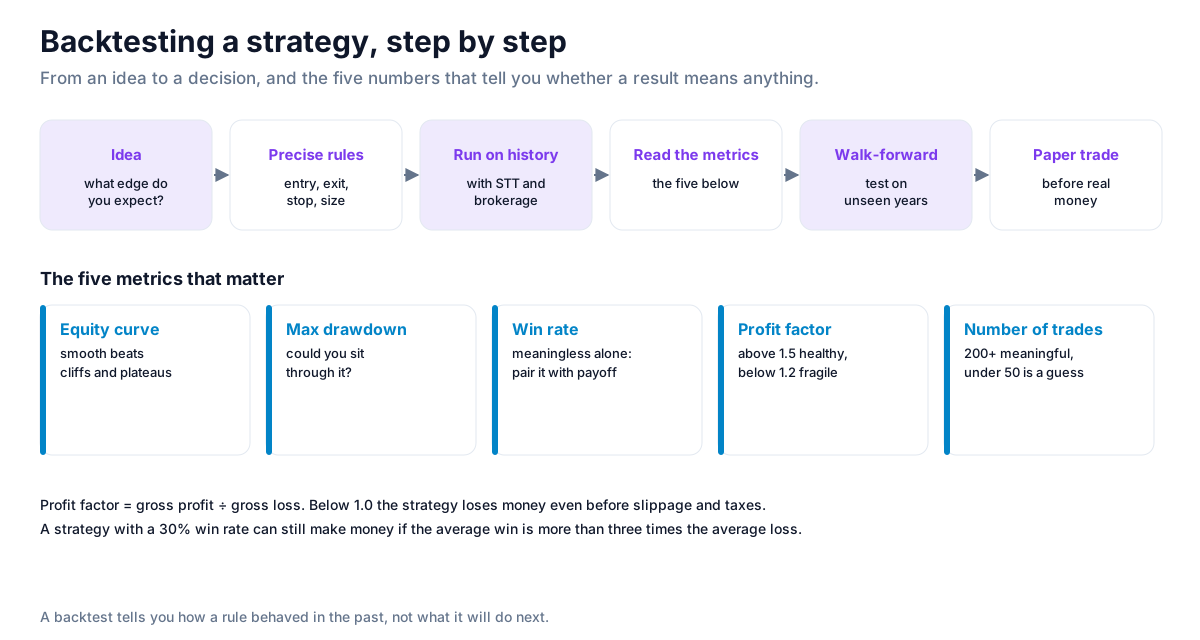
What backtesting actually is
Backtesting is the practice of running a trading rule against historical market data to see how it would have performed. The rule has to be precise enough that a computer can execute it without judgment: "buy when RSI(14) crosses above 30, sell when RSI(14) crosses below 70, with a 3% stop-loss". The output is a simulated equity curve plus metrics - drawdown, win-rate, profit factor, trade-by-trade log.
Why it matters
Three reasons:
- It separates ideas that work from ideas that sound good. Most strategies that "feel right" lose money over 10 years.
- It gives you the worst-case shape - max drawdown, longest losing streak, time-to-recovery. You learn what you'd have to stomach to trade this strategy.
- It forces precision. Defining a strategy tightly enough to backtest exposes the woolly thinking you'd otherwise carry into live trading.
What backtesting isn't
A backtest is not a prediction. The market doesn't owe your strategy the same returns it generated in the past. A strategy that worked from 2018-23 may stop working in 2024 because the volatility regime shifted, or because too many other traders ran the same idea. Backtests give you historical evidence, not future certainty. Treat them accordingly.
The five metrics that matter
- Equity curve. The shape of your strategy's return over time. Smooth uptrend = good. Lots of plateaus and cliffs = harder to trade emotionally.
- Max drawdown. The biggest peak-to-trough loss. If your max drawdown is 40%, ask yourself: can you stomach a 40% loss before recovering? If not, this strategy isn't for you regardless of total return.
- Win-rate. Percentage of trades that were profitable. By itself meaningless - a 30% win-rate strategy can be profitable if avg-win > 3 × avg-loss. Combine with the next metric.
- Profit factor. Gross profit / gross loss. Above 1.5 is healthy. Below 1.2 is fragile. Below 1.0 is unprofitable even before slippage and taxes.
- Number of trades. 10 trades over 5 years is not a backtest - it's a coincidence. 200+ trades is statistically meaningful. Below 50, take any conclusion with caution.
Common beginner pitfalls
- Over-fitting. Tuning parameters until the equity curve looks beautiful on past data, then watching live performance crater. The more you tune, the less your backtest tells you.
- Look-ahead bias. Using information the strategy couldn't have known at the time. Most modern platforms guard against this, but custom logic can sneak it in.
- Cherry-picking date ranges. Choosing the window where your strategy worked. Always test on multiple regimes - trending, choppy, crash, recovery.
- Ignoring friction. No STT, no brokerage, no slippage. The resulting backtest overstates returns by 10-30%.
- Small sample size. Drawing conclusions from a backtest with 20 trades is statistics theatre.
Walk-forward testing - the discipline that separates pros
Split your data. Train (i.e. find best parameters) only on the first chunk - say 2018-22. Then test those exact parameters, unchanged, on 2023-24. If the out-of-sample test works, you have a candidate strategy. If it doesn't, your in-sample success was over-fitting. Walk-forward is uncomfortable because it ruins most beautiful backtests - which is exactly why it's valuable.
What you need to start
A backtesting platform with real Indian market data, ideally no-code (you don't need to learn Python just to backtest). For options, you need real option chain data, not synthetic prices. Unfluke's Basic Backtester handles equity, indices, and multi-leg options. Free tier gives you every feature on the last 3 months of data.
Your first backtest - what to try
Start with something simple and well-known so you have a reference point. Suggested first backtests:
- "Buy Nifty when 50 EMA > 200 EMA, sell when 50 EMA < 200 EMA" - the classic trend-following rule. See if it worked on Nifty 2018-24.
- "Buy Bank Nifty short straddle every Thursday 9:20, exit 3:20 or 30% SL" - the classic short-premium rule. See drawdown profile.
- "RSI(14) < 30 buy, RSI(14) > 70 sell" on Nifty 500 stocks. See whether mean-reversion still works on individual names.
Compare results to your expectations. The gap between what you thought would happen and what the backtest shows is where your learning starts.
Strategy ideas (ideas, not promises)
These are ideas to study, paper-trade and backtest, not recommendations or signals, and not a promise of any result. Your first backtests will mostly show what does not work, which is the point. Size, entries, exits and risk are your own decisions.
1. Start with a simple index rule
- Setup: a 50/200 EMA trend rule on Nifty, tested over several years.
- Use: a baseline every later idea has to beat.
2. Read the five metrics, not the total
- Setup: for every result, note the equity curve, max drawdown, win rate, profit factor and number of trades.
- Invalidation: fewer than 50 trades, or a profit factor below 1.2, is not a reliable result.
3. Hold back the last stretch of data
- Setup: build and tweak on earlier years, then run the final rules once on the most recent period.
- Reading: a strategy that only worked on the years you tuned it on is fitted, not robust.
How to test these
Run each idea on Unfluke's backtester, save the results, and compare them side by side before paper trading the best one.
Honest caveats
Even disciplined backtesting only gets you to a candidate strategy. Live trading adds execution, emotion, position sizing, and the willingness to follow your own rules when 5 losing trades in a row arrive. Backtesting tells you the rule is tradeable. It doesn't tell you you are. Past performance does not guarantee future returns.
Where to go from here
Read the deeper Strategy Backtesting overview, the options-specific How to Backtest an Options Trading Strategy tutorial, or jump straight in and sign up free to run your first backtest.
More from the blog
- Strategy Backtesting on Unfluke
Backtest trading strategies on real Indian market data with Unfluke. Test equity, Nifty, Bank Nifty and options strategies with realistic costs and key metrics.
- Live Market Scanners
Explore Unfluke's real-time stock scanner for NSE markets. Scan 1,800+ stocks with 40+ technical indicators, fundamental filters, F&O data and custom rules.
- Option Strategy Simulator
Build and simulate multi-leg options strategies with Unfluke. Visualize payoffs, Greeks, max profit and loss, and replay historical option data from 2023.