Market Terminal
New 52-Week Lows: Downtrend or Capitulation?
8 min read · Updated 2 Nov 2026
A new 52-week low is neither automatically a bargain nor automatically a warning - it depends on context the price alone does not give. The Lows panel on the 52W High/Low page provides that context.
Trend lows versus capitulation lows
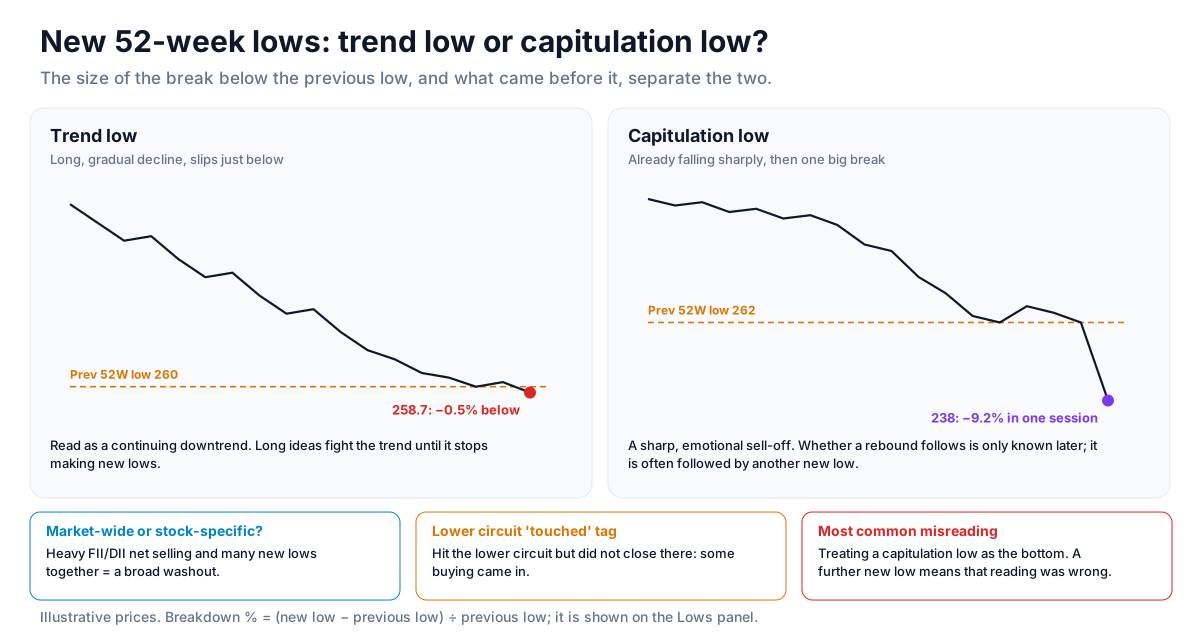
A stock that slips just below its previous 52-week low after a long, gradual decline is typically read as a continuing downtrend. A stock that breaks its previous low by a large margin in a single session, especially after already falling sharply, looks more like capitulation - the term market commentary uses for a sharp, emotional sell-off. Whether a rebound follows is only known later. The breakdown chart on the Lows panel shows which pattern a stock fits.
Adding market-wide context
It helps to check whether a new low is stock-specific or part of a broad washout. If the FII/DII page shows heavy net selling that day and many stocks are making new lows together, the weakness is market-wide - a very different situation from a single company's problem.
Checking circuit behaviour
A stock at a new low that also appears on the lower circuit list on Price Band Hitters with a "touched" tag - it hit the circuit but did not close there - showed some buying interest during the decline. It is a small detail, but analysts often combine it with the breakdown size.
The most common misreading of new lows
The most common misreading is to treat a "capitulation" low as the bottom. It is often followed by yet another new low. That is why market studies of reversals look at what happened in the sessions after a low - for example whether the stock held above it - rather than at the low itself. A further new low simply means the capitulation reading was wrong.
Strategy ideas (ideas, not promises)
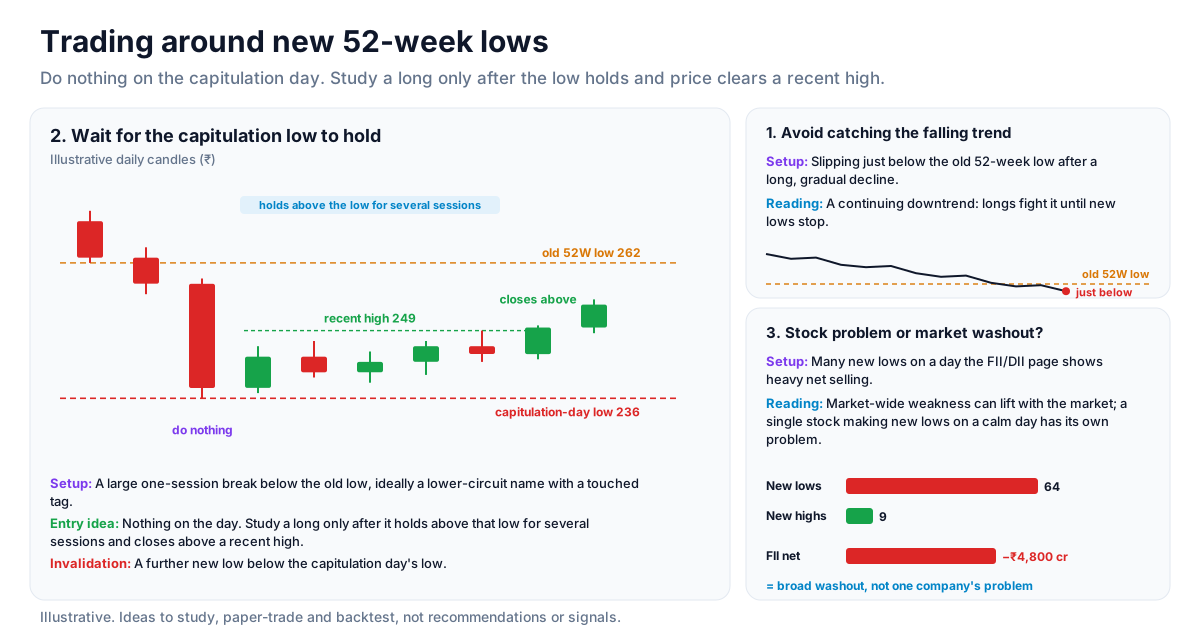
These are ideas to study, paper-trade and backtest, not recommendations or signals, and not a promise of any result. A new low can be followed by another new low; a capitulation reading is only confirmed later. Size, entries, exits and risk are your own decisions.
1. Avoid catching the falling trend
- Setup: A stock slipping just below its previous 52-week low after a long, gradual decline.
- Reading: Treat it as a continuing downtrend; long ideas fight the trend until it stops making new lows.
2. Wait for the capitulation low to hold
- Setup: A large one-session breakdown below the old low, ideally a lower-circuit name with a touched tag.
- Entry idea: Do nothing on the day; study a long idea only after the stock holds above that low for several sessions and closes above a recent high.
- Invalidation: A further new low below the capitulation day's low.
3. Separate a stock problem from a market washout
- Setup: Many stocks making new lows on a day the FII/DII page shows heavy net selling.
- Reading: Market-wide weakness can lift with the market; a single stock making new lows on a calm day has its own problem.
How to test these
Use the date picker to find past capitulation-style lows, then record how many held above the low over the next ten sessions and how many made a further new low.
Where to go next
Read the companion piece, reading 52-week high breakouts, and explore the equity data guide. Try the 52-Week page free.
How to Read This Data
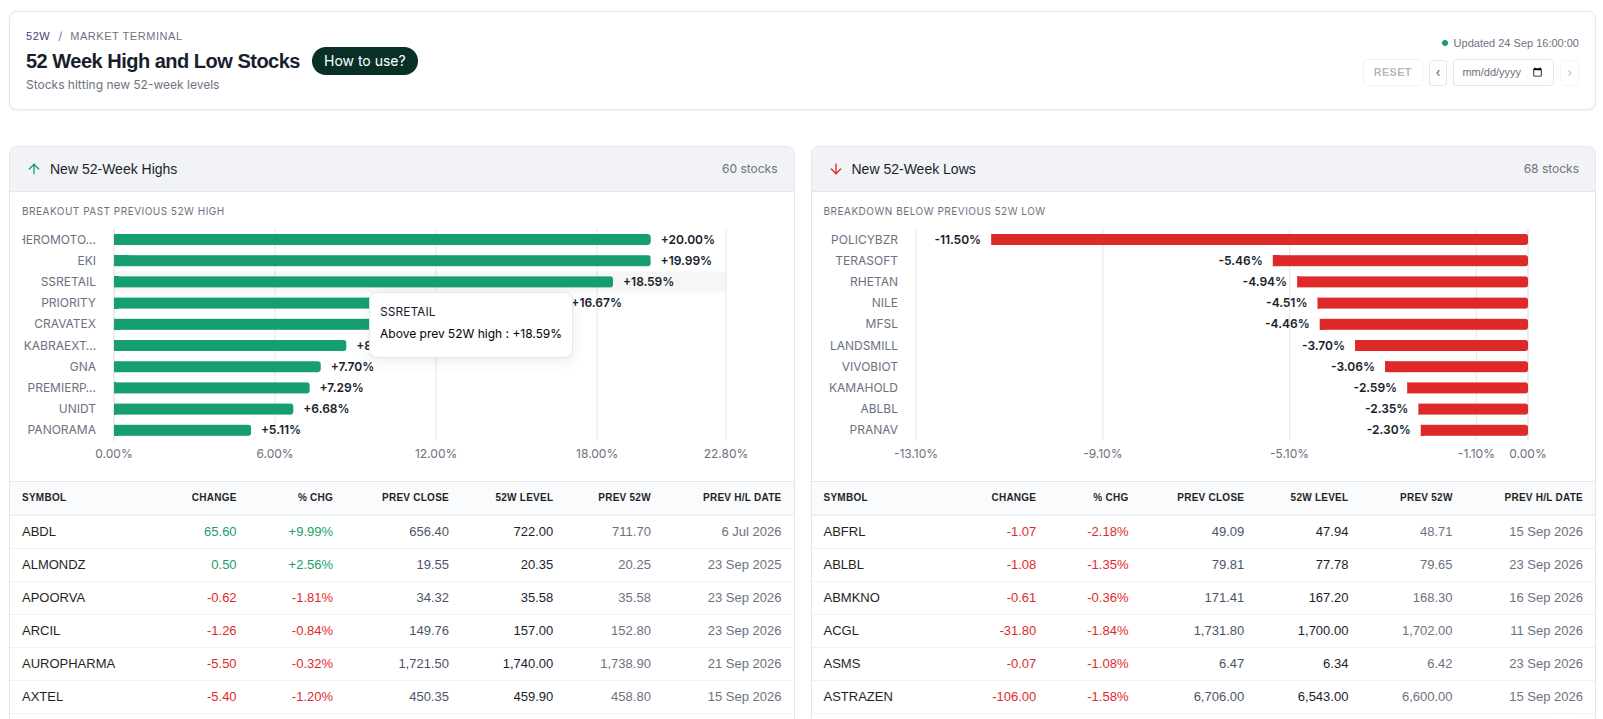
A 52-week high or low marks the top or bottom of a stock's range over the past year. The count of new highs versus new lows is a widely used breadth measure, and the distance by which a level was cleared shows how decisive the move was.
- Compare the number of new highs with new lows to gauge how broad the market's strength or weakness is.
- Look at how far the price cleared the previous high or low; a marginal new level and a large one describe different sessions.
- Note whether the stock closed beyond the level or only touched it during the day.
- Check volume on the day of the new level to see how much participation accompanied it.
Limitations: A new 52-week level is a fact about the past year, not a forecast. Stocks at new highs can fall back and stocks at new lows can keep falling.
More from the blog
- Strategy Backtesting on Unfluke
Backtest trading strategies on real Indian market data with Unfluke. Test equity, Nifty, Bank Nifty and options strategies with realistic costs and key metrics.
- Live Market Scanners
Explore Unfluke's real-time stock scanner for NSE markets. Scan 1,800+ stocks with 40+ technical indicators, fundamental filters, F&O data and custom rules.
- Option Strategy Simulator
Build and simulate multi-leg options strategies with Unfluke. Visualize payoffs, Greeks, max profit and loss, and replay historical option data from 2023.