Market Terminal
52 Week High Stocks: How to Read Breakouts and Their Strength
9 min read · Updated 2 Nov 2026
The 52W High/Low page lists stocks making new 52-week highs and new 52-week lows, and charts how far each new level cleared the previous 52-week extreme.
This guide explains the columns, the breakout chart, and how breakout size separates decisive new highs from marginal ones.
What are 52 week high and low stocks?
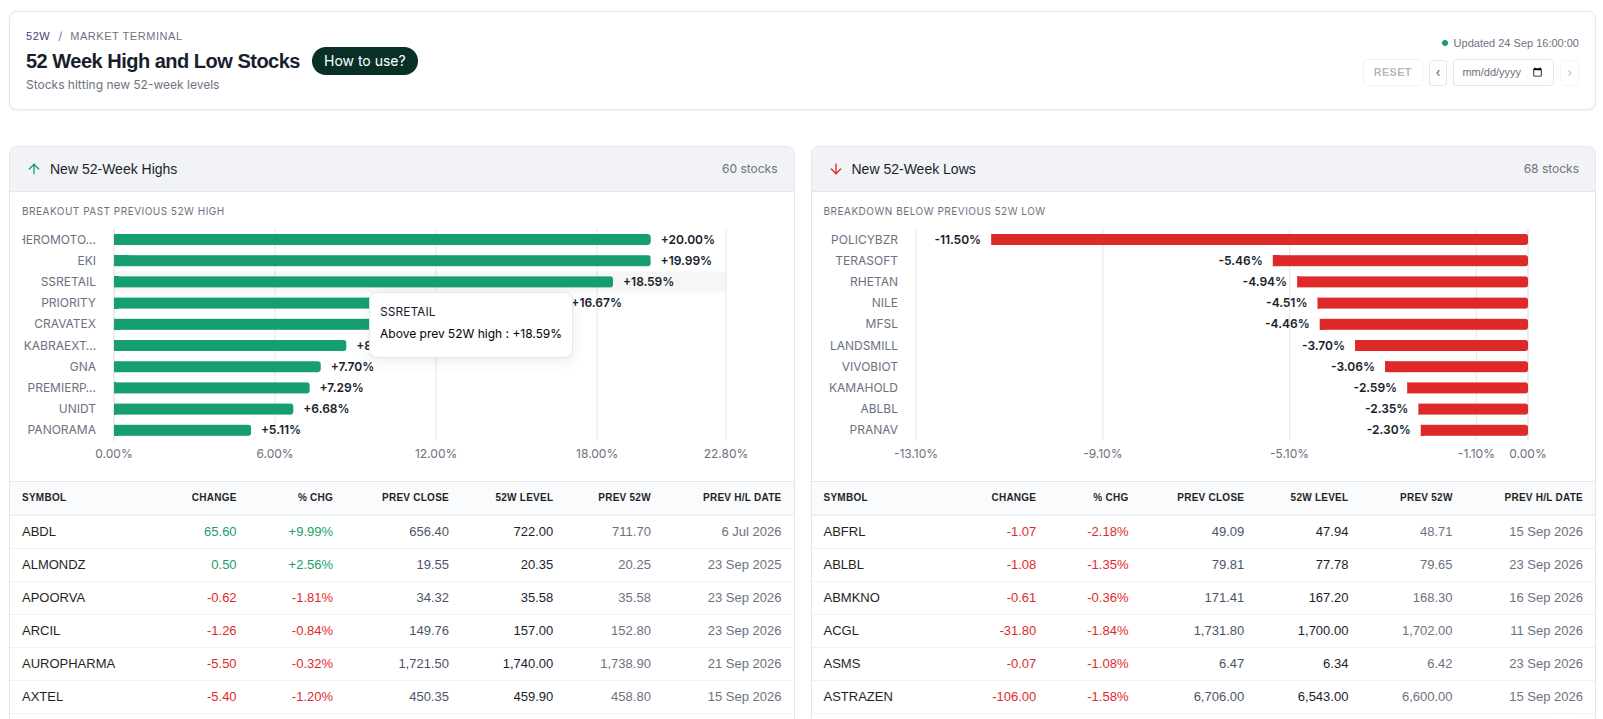
A 52-week high is the highest price a stock has traded at over the past year; a stock making a new one is trading above every price of the last twelve months. A 52-week low is the mirror case. The 52W High/Low page shows two panels - New 52-Week Highs and New 52-Week Lows - each with a stock count, a chart and a table. A date picker loads past sessions.
How to read it
- Breakout chart - the top 10 names by how far the new level cleared the previous 52-week level: (new level − previous level) ÷ previous level. Highs show a breakout above the old high; lows show a breakdown below the old low.
- Change / % Chg - the day's move in the stock.
- Prev Close - the previous session's close.
- 52W Level - the new 52-week high or low.
- Prev 52W - the extreme it replaced.
- Prev H/L Date - when that previous extreme was set.
Reading breakout size
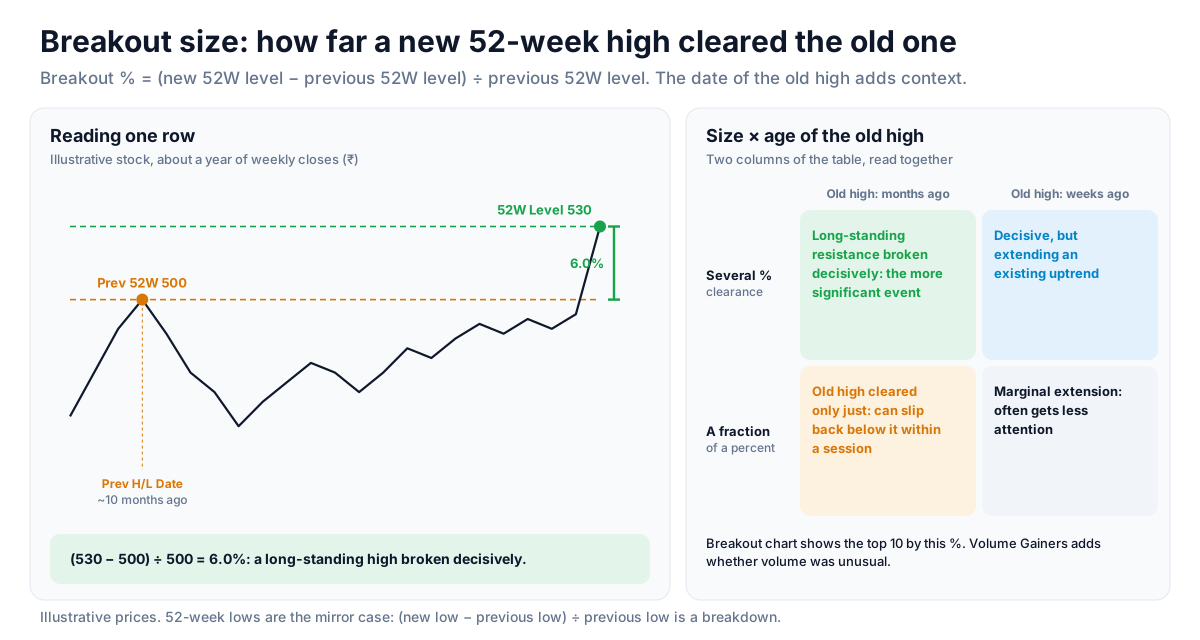
Most 52-week-high screens only say that a stock made a new high. The breakout chart adds how convincingly it did so. A new high that clears the old one by a fraction of a percent can slip back below it within a session; one that clears it by several percent shows much more decisive buying on that day. Reading the chart first, then the table, separates the two quickly.
Concept: breakout magnitude and volume
Market studies often group new highs by magnitude - for example, breakouts of a fraction of a percent versus breakouts of several percent - because the two behave differently as descriptions of a session. Volume adds a second dimension. The Volume Gainers tab shows whether a large breakout came with unusual participation or on ordinary volume, which in a thinly traded stock may reflect a single large order. Neither measure says what the price will do next.
Why the previous-extreme date matters
Prev H/L Date adds context. A stock clearing a high set only a few weeks ago is extending an existing uptrend. A stock clearing a high that stood for most of the year is breaking a much older resistance level, which analysts usually treat as the more significant event.
Strategy ideas (ideas, not promises)
These are ideas to study, paper-trade and backtest, not recommendations or signals, and not a promise of any result. A new 52-week high can slip back below the old high, even after a decisive breakout. Size, entries, exits and risk are your own decisions.
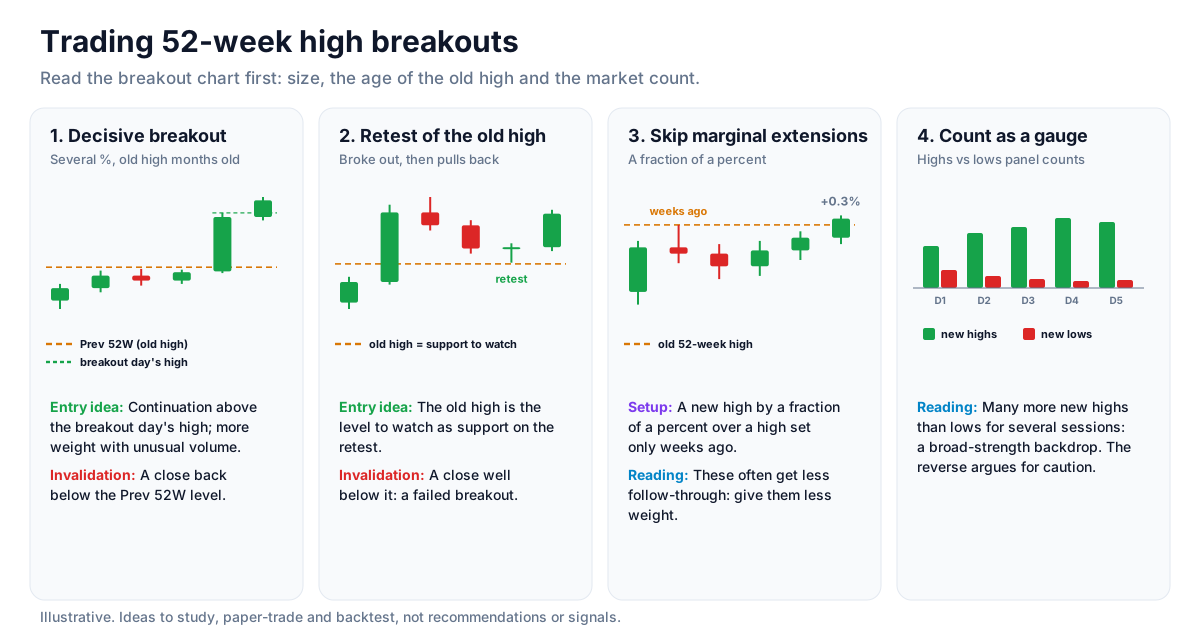
1. Decisive breakout of an old high
- Setup: A stock near the top of the breakout chart, clearing its previous 52-week high by several percent, with a Prev H/L Date many months old.
- Entry idea: Study a continuation above the breakout day's high, with stronger weight when Volume Gainers shows unusual participation.
- Invalidation: A close back below the previous 52-week high (the Prev 52W column).
2. Retest of the broken high
- Setup: A stock that broke out and then pulls back towards the old high.
- Entry idea: The old high is the level to watch as support on the retest.
- Invalidation: A close well below it, which turns the breakout into a failed one.
3. Skip marginal extensions
- Setup: A new high by a fraction of a percent over a high set only weeks ago.
- Reading: These extensions of an existing move often get less follow-through; give them less weight.
4. Use the count as a market gauge
Many more new highs than new lows for several sessions is a broad-strength backdrop for breakout ideas; the reverse argues for caution.
How to test these
Load past sessions, record each new high's breakout size and Prev H/L Date, and track how many stayed above the old high over the next five sessions. Compare the large, long-standing breakouts with the marginal ones.
Where to go next
Read the other side in how analysts study new 52-week lows, or return to the equity data guide. Try the 52-Week page free.
How to Read This Data
A 52-week high or low marks the top or bottom of a stock's range over the past year. The count of new highs versus new lows is a widely used breadth measure, and the distance by which a level was cleared shows how decisive the move was.
- Compare the number of new highs with new lows to gauge how broad the market's strength or weakness is.
- Look at how far the price cleared the previous high or low; a marginal new level and a large one describe different sessions.
- Note whether the stock closed beyond the level or only touched it during the day.
- Check volume on the day of the new level to see how much participation accompanied it.
Limitations: A new 52-week level is a fact about the past year, not a forecast. Stocks at new highs can fall back and stocks at new lows can keep falling.
More from the blog
- Strategy Backtesting on Unfluke
Backtest trading strategies on real Indian market data with Unfluke. Test equity, Nifty, Bank Nifty and options strategies with realistic costs and key metrics.
- Live Market Scanners
Explore Unfluke's real-time stock scanner for NSE markets. Scan 1,800+ stocks with 40+ technical indicators, fundamental filters, F&O data and custom rules.
- Option Strategy Simulator
Build and simulate multi-leg options strategies with Unfluke. Visualize payoffs, Greeks, max profit and loss, and replay historical option data from 2023.