Market Terminal
When Sector Indices Diverge From Nifty: A Divergence Framework
8 min read · Updated 2 Nov 2026
When Nifty is flat but Nifty Bank is up sharply, or Nifty is green while Nifty IT is deep red, sectors are diverging from the benchmark - and that usually means something specific is happening beneath the headline number. The Indices page makes this easy to spot because every index sits in one table.
Two kinds of divergence
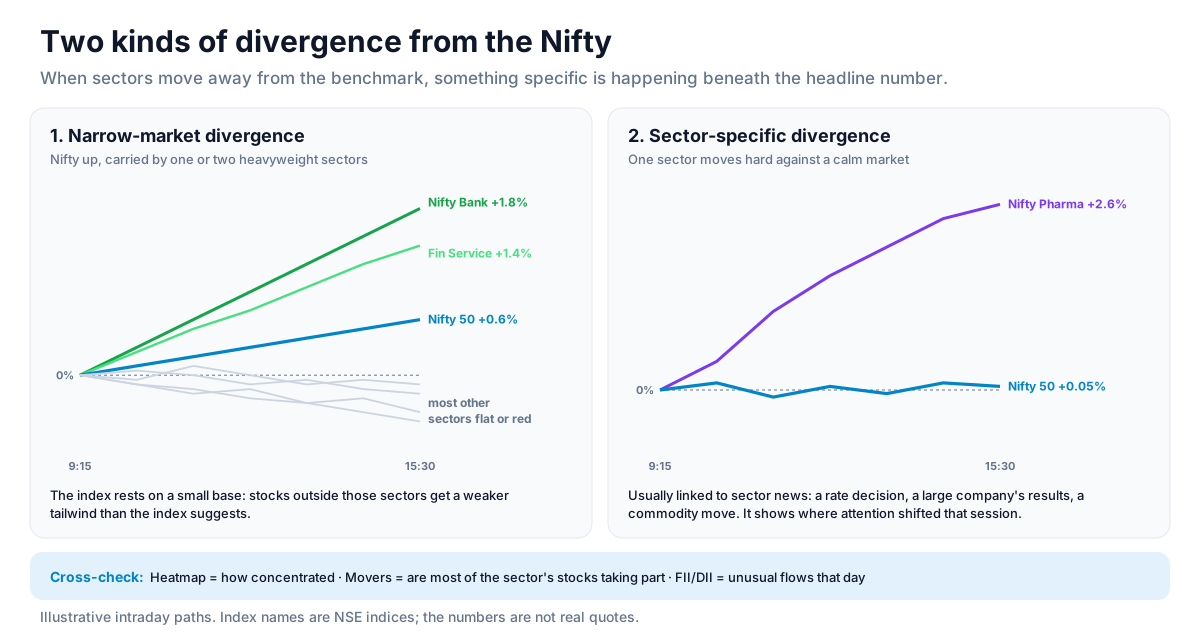
Narrow-market divergence - Nifty is up, but driven by one or two heavyweight sectors while most others are flat or red; the heatmap shows how concentrated it is. Sector-specific divergence - one sector moves sharply against a calm broad market, usually linked to sector news such as a rate decision, a large company's results or a commodity move.
Reading narrow-market divergence
When the index rises on the back of a few sectors, the broad tailwind that stocks outside those sectors would normally have is weaker than the index suggests. It is also a time when index-level derivatives can behave differently from what individual stock charts imply, because the index print rests on a small base.
Reading sector-specific divergence
A sector index moving sharply away from Nifty shows where the market's attention shifted that session, without waiting for weeks of ranking data. The Movers page shows whether stocks in that sector are broadly participating or whether one or two names account for most of the move.
Cross-checking with FII/DII flows
Divergence days - Nifty flat, several sectors moving hard in opposite directions - sometimes coincide with unusual institutional flows. The FII/DII page for the same session shows whether large net buying or selling was part of the picture.
Strategy ideas (ideas, not promises)
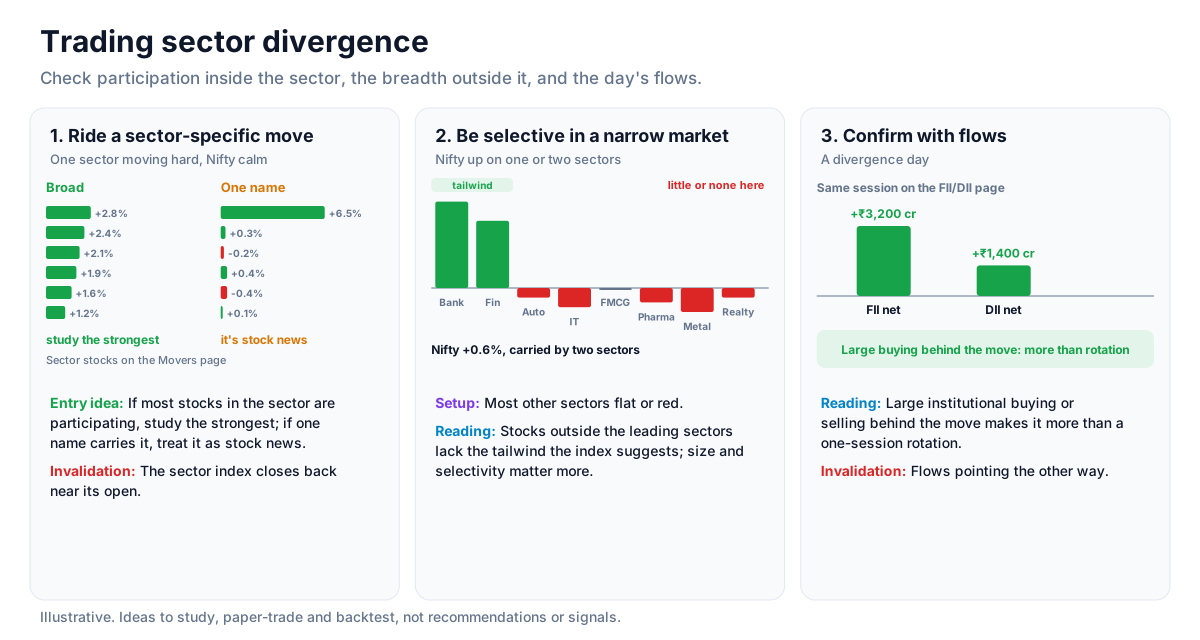
These are ideas to study, paper-trade and backtest, not recommendations or signals, and not a promise of any result. A divergence describes where the market's attention went; how long it lasts is unknown. Size, entries, exits and risk are your own decisions.
1. Ride a sector-specific move
- Setup: One sector index moving sharply while Nifty 50 is calm.
- Entry idea: Check the Movers page: if most stocks in the sector are participating, study the strongest of them; if one name carries the move, treat it as stock news.
- Invalidation: The sector index closing back near its open.
2. Be selective in a narrow market
- Setup: Nifty up on one or two heavyweight sectors while most others are flat or red.
- Reading: Stocks outside the leading sectors lack the tailwind the index suggests; size and selectivity matter more on such days.
3. Confirm with flows
- Setup: A divergence day.
- Reading: Check the FII/DII page: large institutional buying or selling behind the move makes it more than a one-session rotation.
- Invalidation: Flows pointing the other way.
How to test these
Use the Indices page date picker to find past divergence days, then follow the diverging sector over the next week to see how often the move continued or reversed.
Where to go next
Pair this with reading relative strength on the Indices page. Sign up free to watch every index.
How to Read This Data
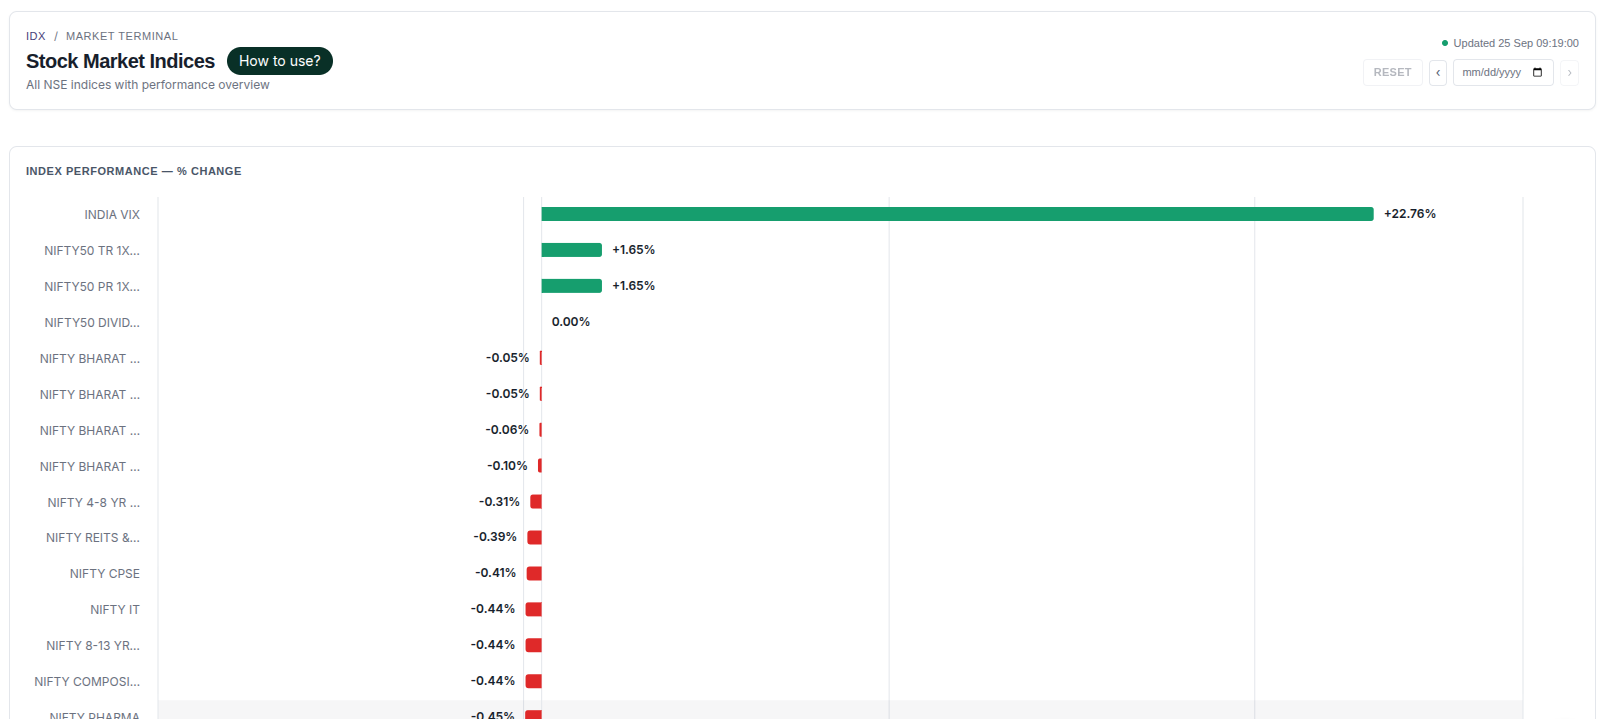
The indices screen lists every NSE index with its level and change. Comparing broad indices with sector and thematic indices shows which parts of the market are outperforming or lagging the benchmark — a concept usually called relative strength.
- Compare a sector index's change with the NIFTY 50 to see whether the sector outperformed or lagged.
- Compare broad indices (large, mid and small cap) to see whether a move was market-wide or concentrated.
- Note the day's high and low next to the close to understand how volatile the session was.
- Track the same comparison over several sessions; one day's relative strength can be noise.
Limitations: Index data describes groups, not individual stocks. A stock can behave very differently from its sector index, and past relative strength does not predict future performance.
More from the blog
- Strategy Backtesting on Unfluke
Backtest trading strategies on real Indian market data with Unfluke. Test equity, Nifty, Bank Nifty and options strategies with realistic costs and key metrics.
- Live Market Scanners
Explore Unfluke's real-time stock scanner for NSE markets. Scan 1,800+ stocks with 40+ technical indicators, fundamental filters, F&O data and custom rules.
- Option Strategy Simulator
Build and simulate multi-leg options strategies with Unfluke. Visualize payoffs, Greeks, max profit and loss, and replay historical option data from 2023.