Market Terminal
NSE Indices Today: How to Read Them and Track Relative Strength
9 min read · Updated 2 Nov 2026
The Indices page lists every NSE index - broad market and sectoral - in one table, with a ranked chart of % change from strongest to weakest.
This guide explains each column and how analysts use the ranking to study relative strength between sectors.
What are NSE indices?
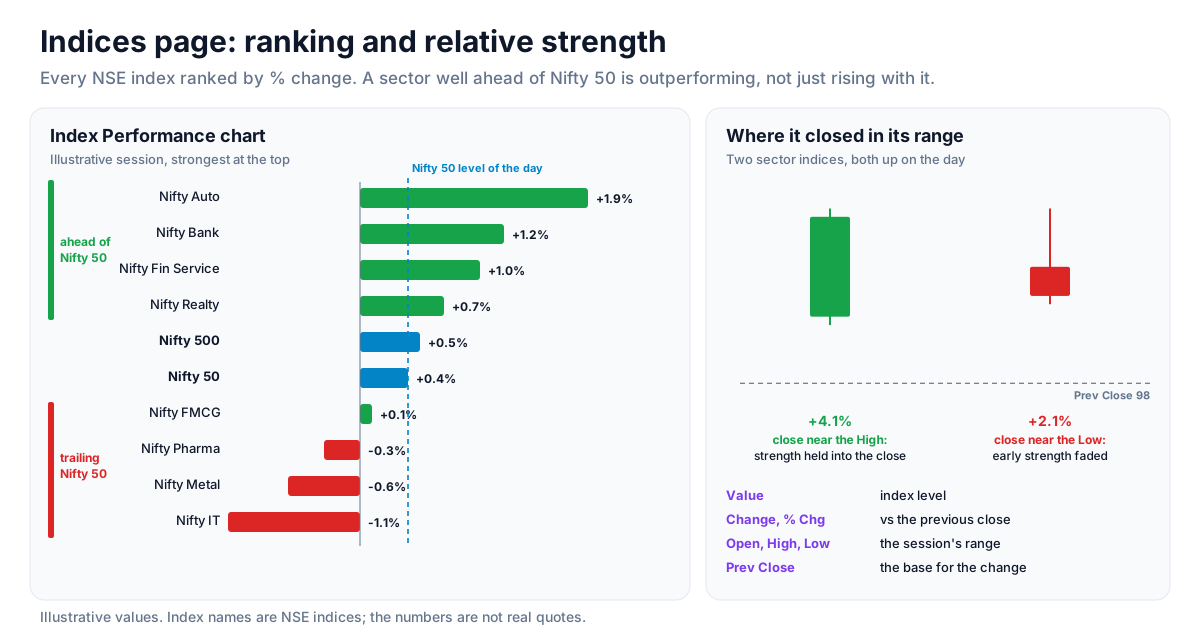
An index tracks a basket of stocks: broad-market indices such as Nifty 50 or Nifty 500 follow the market as a whole, while sectoral indices such as Nifty Bank, Nifty IT or Nifty Auto follow one industry. The Indices page puts all of them side by side for the current session, or for a past session through the date picker.
How to read it
- Index Performance chart - every index ranked by % change, strongest at the top.
- Value - the index level.
- Change and % Chg - points and percent moved against the previous close.
- Open, High, Low - the session's opening level and range.
- Prev Close - the level the change is measured from.
- Last Updated - when that index's data was last refreshed.
Reading the ranking
Start from the chart: it shows at a glance which sectors lead and lag in the session. Then compare the leaders with the broad indices - a sector well ahead of Nifty 50 is outperforming the market, not just rising with it. Where an index closes within its High-Low range adds context on whether strength held into the close.
Concept: relative strength rotation
Relative strength rotation is a well-known idea in market research. It describes the observation that sectors which have outperformed recently have, in many past periods, kept outperforming for a while before leadership changed. It is an observation about history, not a rule the market must follow.
One simple way to observe it is to record the top three and bottom three indices each Friday. Over several weeks a pattern appears - an index that stays in the top three week after week is showing more persistence than one that appears once. When a long-standing leader drops out of the top ranks, that change is part of the same picture. The constituents of any index can be studied stock by stock using the heatmap's sector view and the Movers page.
Strategy ideas (ideas, not promises)
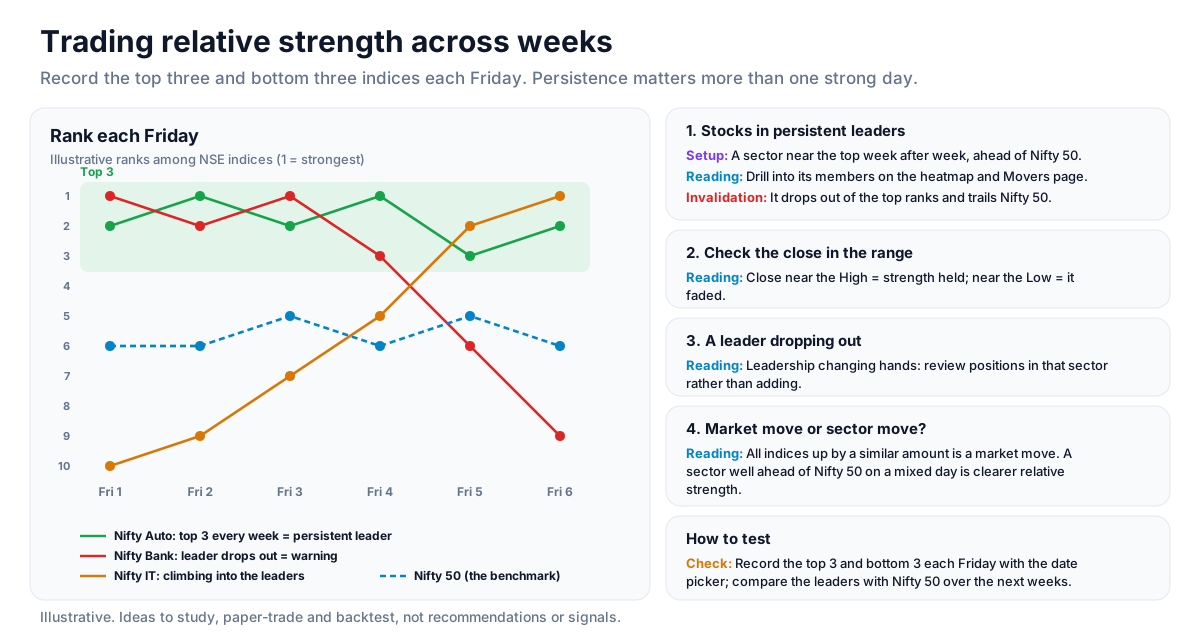
These are ideas to study, paper-trade and backtest, not recommendations or signals, and not a promise of any result. Sector leadership changes, often without warning, and a strong day says little about the next one. Size, entries, exits and risk are your own decisions.
1. Look for stocks in the persistent leaders
- Setup: a sector index that sits near the top of the Index Performance chart week after week, ahead of Nifty 50, not just on one session.
- Reading: drill into its members with the heatmap's sector view and the Movers page, and study the stocks leading it rather than the index alone.
- Invalidation: the index drops out of the top ranks and starts trailing Nifty 50.
2. Check where the index closed in its range
- Setup: a sector with a strong % Chg.
- Reading: a close near the session High says the strength held into the close; a close near the Low says it faded. The first is the stronger case for leadership.
3. Treat a leader dropping out as a warning
- Setup: a sector that led for several weeks falls to the middle or bottom of the ranking.
- Reading: rotation studies treat this as leadership changing hands. Existing positions in that sector deserve a review rather than an automatic add.
4. Separate a market move from a sector move
When every index is up by a similar amount, the market is moving, not any one sector. A sector well ahead of Nifty 50 on a mixed day is a clearer sign of relative strength than one rising with everything else.
How to test these
Use the date picker to record the top three and bottom three indices each Friday over past months, then check how the leaders did over the following weeks compared with Nifty 50. The Sector Rotation graph shows the same idea as a chart.
Where to go next
Read sector versus broad-market divergence next, or start from the equity data guide. Try the Indices page free.
How to Read This Data
The indices screen lists every NSE index with its level and change. Comparing broad indices with sector and thematic indices shows which parts of the market are outperforming or lagging the benchmark — a concept usually called relative strength.
- Compare a sector index's change with the NIFTY 50 to see whether the sector outperformed or lagged.
- Compare broad indices (large, mid and small cap) to see whether a move was market-wide or concentrated.
- Note the day's high and low next to the close to understand how volatile the session was.
- Track the same comparison over several sessions; one day's relative strength can be noise.
Limitations: Index data describes groups, not individual stocks. A stock can behave very differently from its sector index, and past relative strength does not predict future performance.
More from the blog
- Strategy Backtesting on Unfluke
Backtest trading strategies on real Indian market data with Unfluke. Test equity, Nifty, Bank Nifty and options strategies with realistic costs and key metrics.
- Live Market Scanners
Explore Unfluke's real-time stock scanner for NSE markets. Scan 1,800+ stocks with 40+ technical indicators, fundamental filters, F&O data and custom rules.
- Option Strategy Simulator
Build and simulate multi-leg options strategies with Unfluke. Visualize payoffs, Greeks, max profit and loss, and replay historical option data from 2023.