Market Terminal
Upper Circuit and Lower Circuit Stocks: How to Read Price Bands
10 min read · Updated 2 Nov 2026
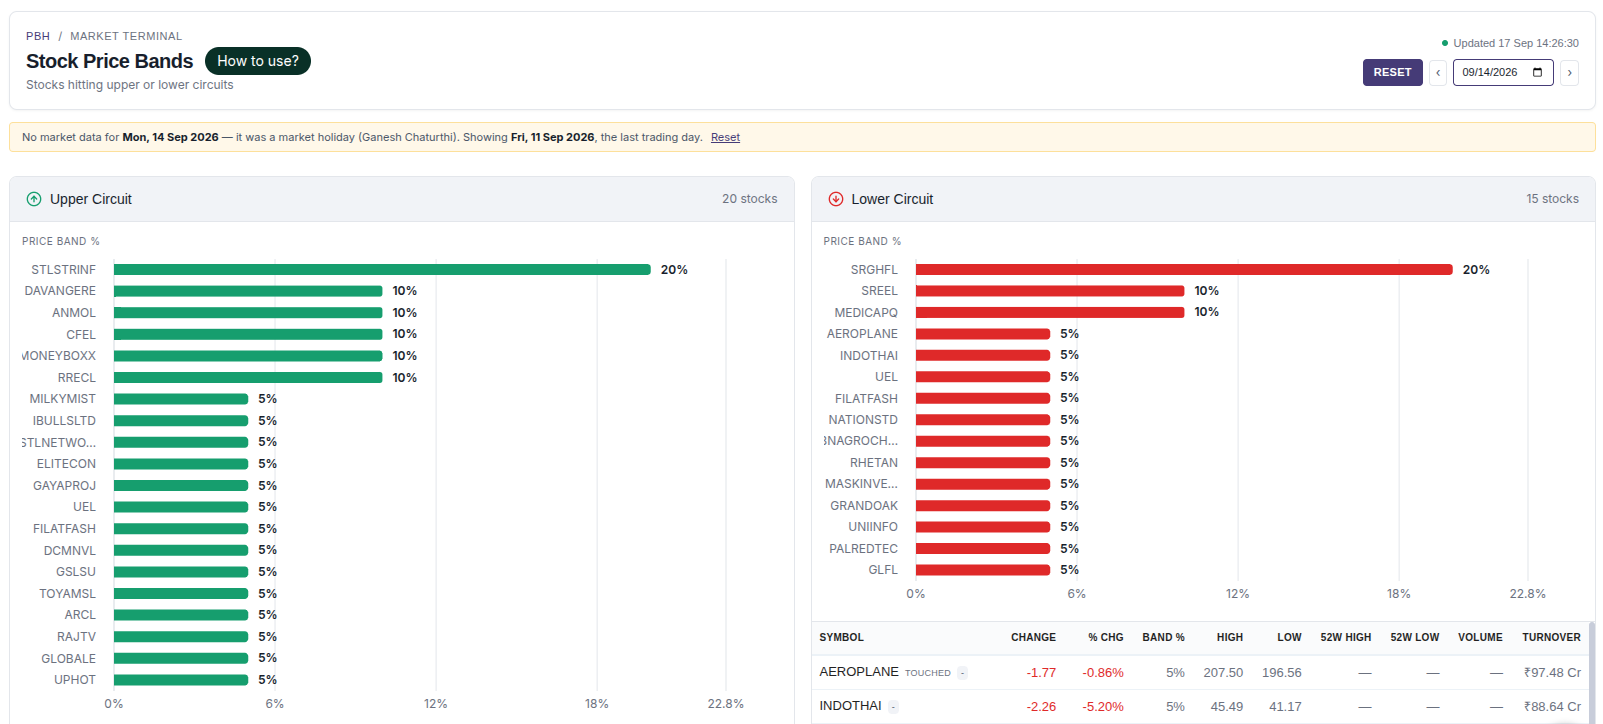
The Price Band Hitters page lists stocks that hit their upper circuit or lower circuit, shows each stock's price band size, and flags stocks that only touched the circuit or are under exchange surveillance.
This guide explains price bands, how to read every column, and why a 20% band stock hitting its circuit means something different from a 2% band stock doing the same.
What are upper and lower circuits?
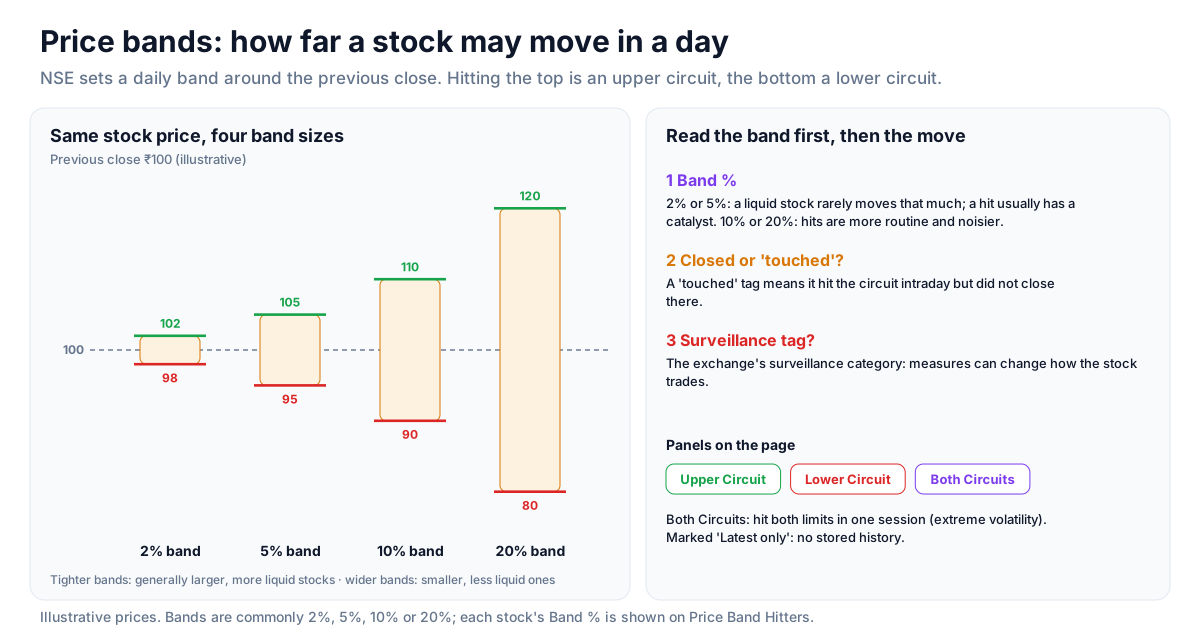
NSE sets a daily price band for most stocks - a maximum percentage the price can move in either direction from the previous close. Bands are commonly 2%, 5%, 10% or 20%. When a stock reaches the top of its band it has hit its upper circuit; at the bottom, its lower circuit.
The Price Band Hitters page has Upper Circuit and Lower Circuit panels and a Both Circuits panel for stocks that hit both limits in the same session.
How to read it
- Price band % chart - each stock's band size, so tight-band and wide-band names are easy to separate.
- Symbol tags - "touched" means the stock hit the circuit intraday but did not close there; a surveillance tag shows the exchange's surveillance category.
- Change / % Chg - the day's move.
- Band % - the stock's price band.
- High / Low - the session's range.
- 52W High / 52W Low - the yearly range for context.
- Volume and Turnover - how much traded.
- Both Circuits - marked "Latest only": it has no stored history, so it always shows the current session.
Reading the band first
Read the band first, then the move. NSE generally assigns tighter bands to larger, more liquid stocks and wider bands to smaller, less liquid ones, so the band size is itself a rough indicator of a stock's liquidity. From there, the touched tag and the surveillance flag help qualify what kind of circuit hit it was.
Tight-band (2%/5%) circuit hits
A liquid, tight-band stock reaching its circuit is unusual - these stocks rarely move that much in a day. Such hits are often studied closely for the catalyst behind them, for example on Market Info's corporate actions tab or in company news, because noise alone rarely produces them.
Wide-band (10%/20%) circuit hits
Smaller, wide-band stocks hit circuits far more routinely, sometimes on thin news or small order imbalances. These hits carry more noise, which is why the touched-versus-closed distinction (see the touched versus closed article) matters most here. A stock in Both Circuits reflects extreme volatility in a single session.
Strategy ideas (ideas, not promises)
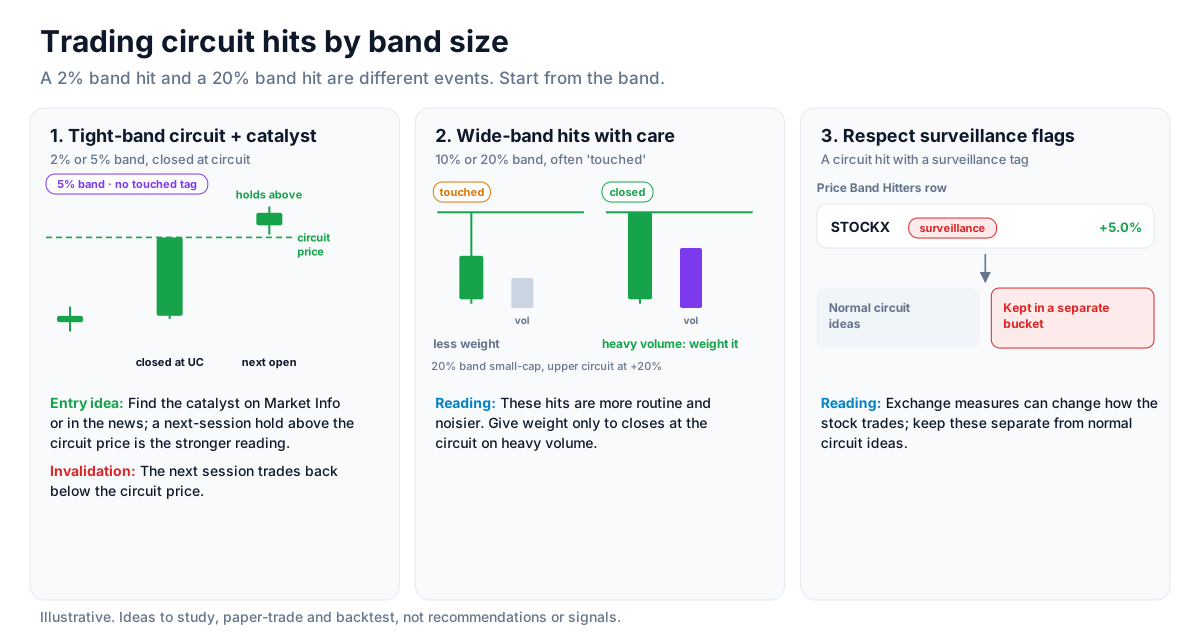
These are ideas to study, paper-trade and backtest, not recommendations or signals, and not a promise of any result. A circuit hit describes one session's imbalance; it does not say how the next session will trade. Size, entries, exits and risk are your own decisions.
1. Tight-band circuit with a catalyst
- Setup: A liquid 2% or 5% band stock that closed at its upper circuit without a touched tag.
- Entry idea: Find the catalyst on Market Info or in the news, then study the next session's open: a hold above the circuit price is the stronger reading.
- Invalidation: The next session trading back below the circuit price.
2. Treat wide-band hits with more care
- Setup: A 10% or 20% band small-cap on Upper Circuit, especially one tagged touched.
- Reading: These hits are more routine and noisier; give weight only to closes at the circuit on heavy volume.
3. Respect surveillance flags
- Setup: A circuit hit with a surveillance tag.
- Reading: Exchange measures can change how the stock trades; keep these separate from normal circuit ideas.
How to test these
Use the date picker to collect past circuit hits, split them by band size and by touched versus closed, and record how the next few sessions traded in each group.
Where to go next
Read touched versus closed at circuit next, or return to the equity data guide. Try the Price Band page free.
How to Read This Data
Exchanges set daily price bands (circuits) that limit how far a stock can move in one session. The price-band screen lists stocks that reached those limits. Whether a stock only touched the band or closed there shows whether buying or selling pressure lasted through the session.
- Separate stocks that closed at the band from those that touched it and moved away.
- Check the band size (for example 5%, 10% or 20%); it changes how significant a band hit is.
- Note turnover: a band hit on very low turnover reflects very few trades.
- Look at the following session's open to see how the stock traded once the band reset.
Limitations: Stocks at their band can have few counterparties, so prices may not reflect normal trading. A band hit says nothing reliable about the next session.
More from the blog
- Strategy Backtesting on Unfluke
Backtest trading strategies on real Indian market data with Unfluke. Test equity, Nifty, Bank Nifty and options strategies with realistic costs and key metrics.
- Live Market Scanners
Explore Unfluke's real-time stock scanner for NSE markets. Scan 1,800+ stocks with 40+ technical indicators, fundamental filters, F&O data and custom rules.
- Option Strategy Simulator
Build and simulate multi-leg options strategies with Unfluke. Visualize payoffs, Greeks, max profit and loss, and replay historical option data from 2023.