Market Terminal
Touched vs Closed at Circuit: What the Difference Tells You
7 min read · Updated 2 Nov 2026
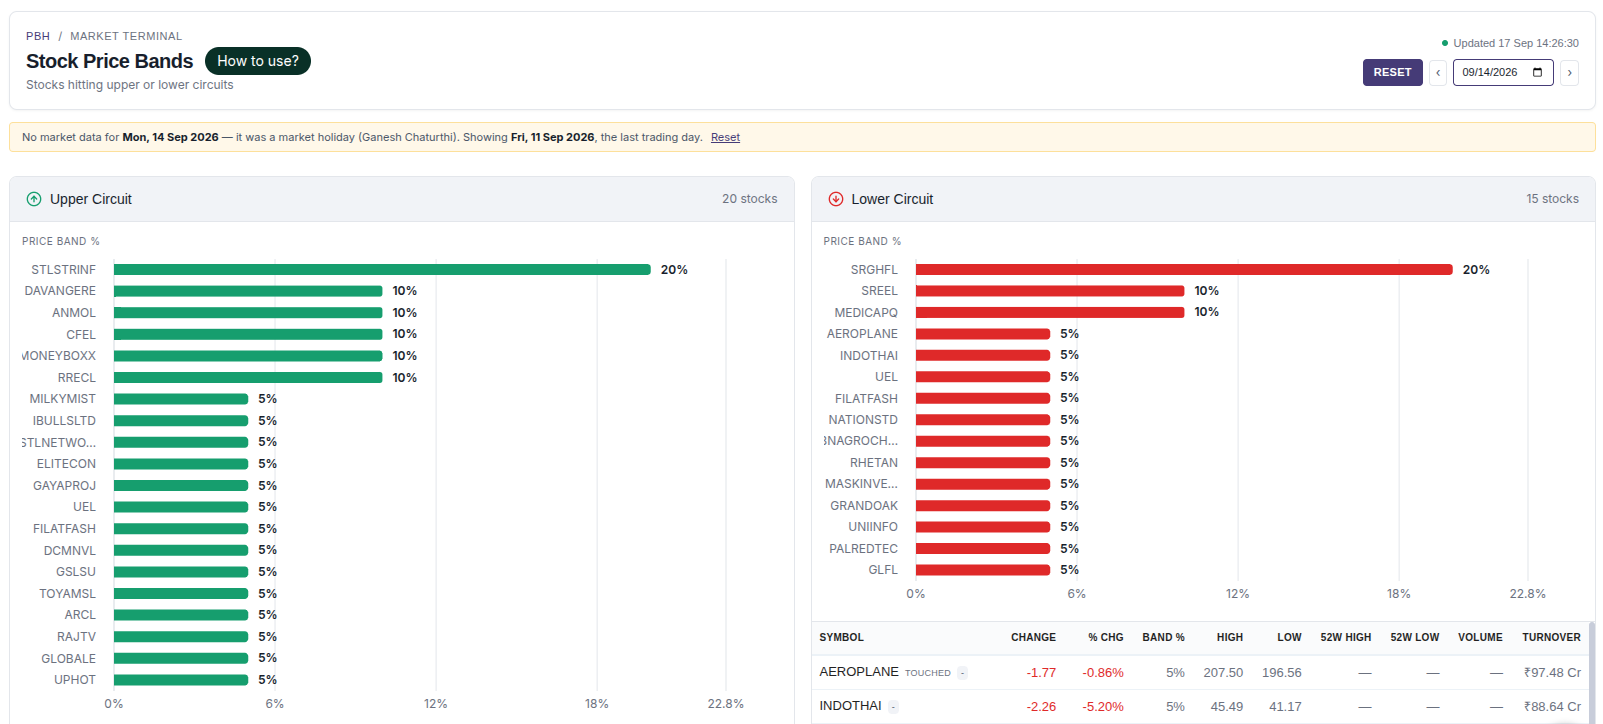
A stock that hits its upper circuit and stays there until the close tells a different story from one that touches the circuit and falls back before the bell. The Price Band Hitters page marks the second case with a "touched" tag.
Closed at circuit: demand left unfilled
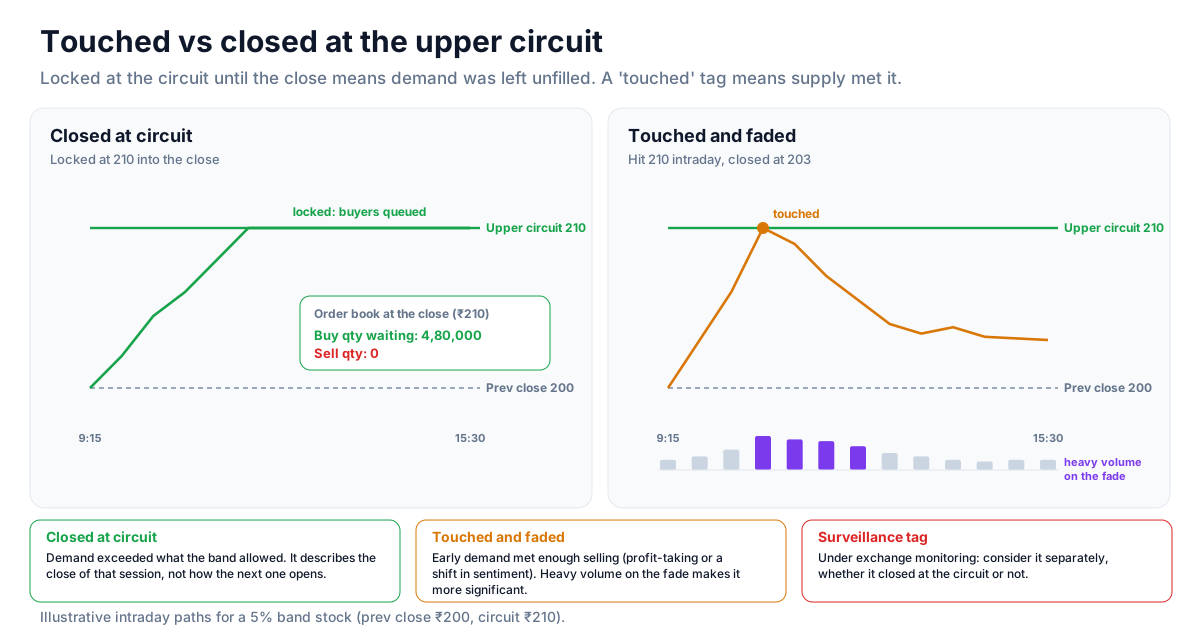
A stock that closes locked at its upper circuit still had buyers queued at the end of the day with no sellers willing to trade - demand exceeded what the price band allowed. It describes an imbalance at the close of that session; it does not tell you how the next session will open.
Touched and faded: supply met demand
A touched tag means strong early demand met enough selling to push the price back - often profit-taking by early buyers, or a real shift in sentiment during the session. Heavy volume on the fade, visible on the Volume Gainers tab, makes it a more significant fade than one on light volume.
The surveillance flag
Some rows carry a surveillance tag for stocks under exchange monitoring. Surveillance measures can change how a stock trades, so a circuit hit with a surveillance flag deserves separate consideration regardless of whether it closed at the circuit.
Reading the next session
For stocks that closed locked at circuit, the next session's opening shows how the unfilled demand was resolved - how gaps are measured is covered in reading gap up and gap down stocks. Stocks that only touched and faded had already met enough selling within the session, so there is less left unresolved.
Strategy ideas (ideas, not promises)
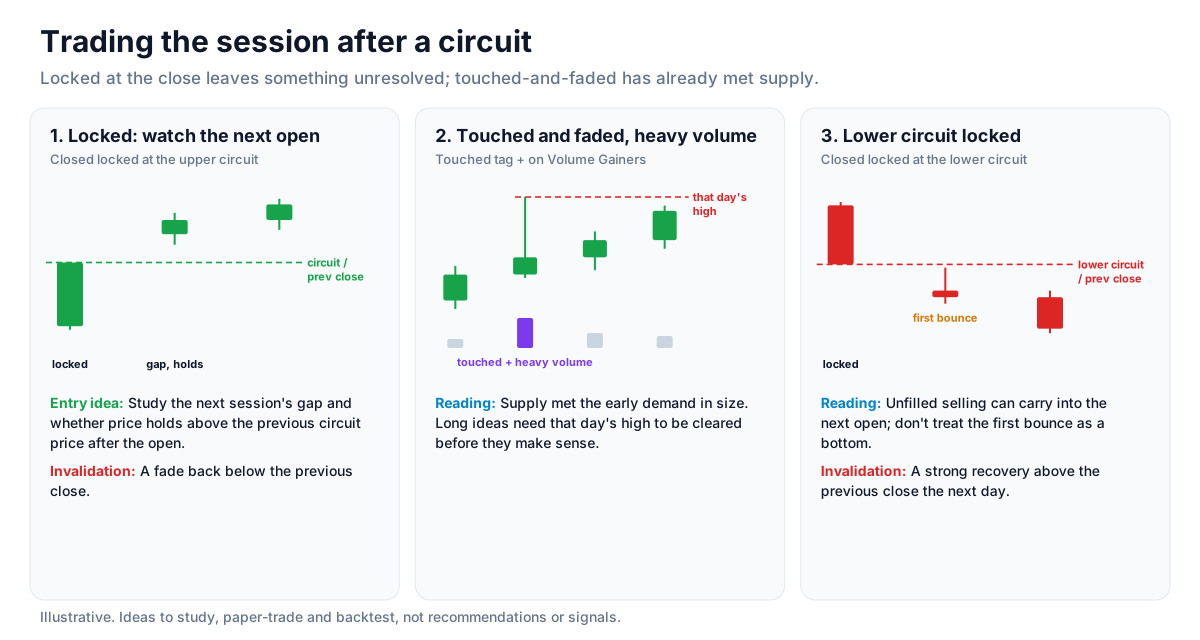
These are ideas to study, paper-trade and backtest, not recommendations or signals, and not a promise of any result. A stock locked at its circuit can open anywhere the next day. Size, entries, exits and risk are your own decisions.
1. Locked at circuit: watch the next open
- Setup: A stock that closed locked at its upper circuit.
- Entry idea: Study the next session's gap and whether the price holds above the previous circuit price after the open.
- Invalidation: A fade back below the previous close.
2. Touched and faded on heavy volume
- Setup: A touched tag together with an appearance on Volume Gainers.
- Reading: Supply met the early demand in size; long ideas in the stock need the high of that day to be cleared before they make sense.
3. Lower circuit locked
- Setup: A stock locked at its lower circuit.
- Reading: Unfilled selling can carry into the next open; avoid treating the first bounce as a bottom.
- Invalidation: A strong recovery above the previous close the next day.
How to test these
On past sessions, split upper-circuit stocks into closed and touched, and compare their next-day gaps and their moves over the following week.
Where to go next
Read how to read upper and lower circuit stocks for the companion piece, or the equity data guide. Try the Price Band page free.
How to Read This Data
Exchanges set daily price bands (circuits) that limit how far a stock can move in one session. The price-band screen lists stocks that reached those limits. Whether a stock only touched the band or closed there shows whether buying or selling pressure lasted through the session.
- Separate stocks that closed at the band from those that touched it and moved away.
- Check the band size (for example 5%, 10% or 20%); it changes how significant a band hit is.
- Note turnover: a band hit on very low turnover reflects very few trades.
- Look at the following session's open to see how the stock traded once the band reset.
Limitations: Stocks at their band can have few counterparties, so prices may not reflect normal trading. A band hit says nothing reliable about the next session.
More from the blog
- Strategy Backtesting on Unfluke
Backtest trading strategies on real Indian market data with Unfluke. Test equity, Nifty, Bank Nifty and options strategies with realistic costs and key metrics.
- Live Market Scanners
Explore Unfluke's real-time stock scanner for NSE markets. Scan 1,800+ stocks with 40+ technical indicators, fundamental filters, F&O data and custom rules.
- Option Strategy Simulator
Build and simulate multi-leg options strategies with Unfluke. Visualize payoffs, Greeks, max profit and loss, and replay historical option data from 2023.