Crypto
Crypto Gann Cardinal and Diagonal Cross: Strong Square of 9 Levels on BTC and ETH
8 min read · Updated 9 Nov 2026
On the Square of 9, the numbers on the vertical and horizontal lines through the centre form the cardinal cross; those on the two diagonals form the diagonal cross. Gann treated the cardinal levels as the stronger set and the diagonal ones as secondary.
On crypto the page tells a very different story for BTC than for everything else. This guide gives the rules, explains why BTC is on the list nearly every day, reads BTC on 6 November and ETH on 4 November 2026, and shows how to judge when a tag is worth a look.
The rules
- Cardinal levels - 90°, 180°, 270° and 360° above and below yesterday's close.
- Diagonal levels - 45°, 135°, 225° and 315° above and below.
- At Cardinal / At Diagonal - today's close within 0.5% of such a level.
- Crossed Cardinal Up - yesterday below a cardinal level above the start, today above it. Crossed Cardinal Down is the mirror.
- A pair is listed only if it carries at least one tag; the row shows the level nearest the close.
Level at angle A = (√start ± A ÷ 180)². Moving 45° adds 0.25 to the square root, 90° adds 0.5, 180° adds 1 and 360° adds 2. Add for resistance above the start, subtract for support below it. From BTCUSDT's 8 November 2026 close of 75,908.65, √ = 275.52; adding 0.25 and squaring gives 76,046.47, the first resistance at 45°.
What changes on crypto
- BTC is almost always "at" a level. Its cardinal levels are about 0.36% apart, so one is always within 0.18% of any price inside the ±360° band. As long as BTC closes within about 1.5% of yesterday, it is At cardinal. It was on the list on all 20 liquid days from 10 October to 6 November 2026.
- ETH and BNB are where tags carry information. Their cardinal levels are 2% to 4% apart, roughly one normal day, so being at one is a real coincidence of price and level.
- Most coins never appear. Under about 50 USDT the nearest cardinal level is weeks of normal moves away. Between 10 October and 6 November only BTC, ETH, BNB, SOL and LTC appeared.
Real readings: BTC on 6 November, ETH on 4 November 2026
BTCUSDT, 6 November: three tags on an ordinary day
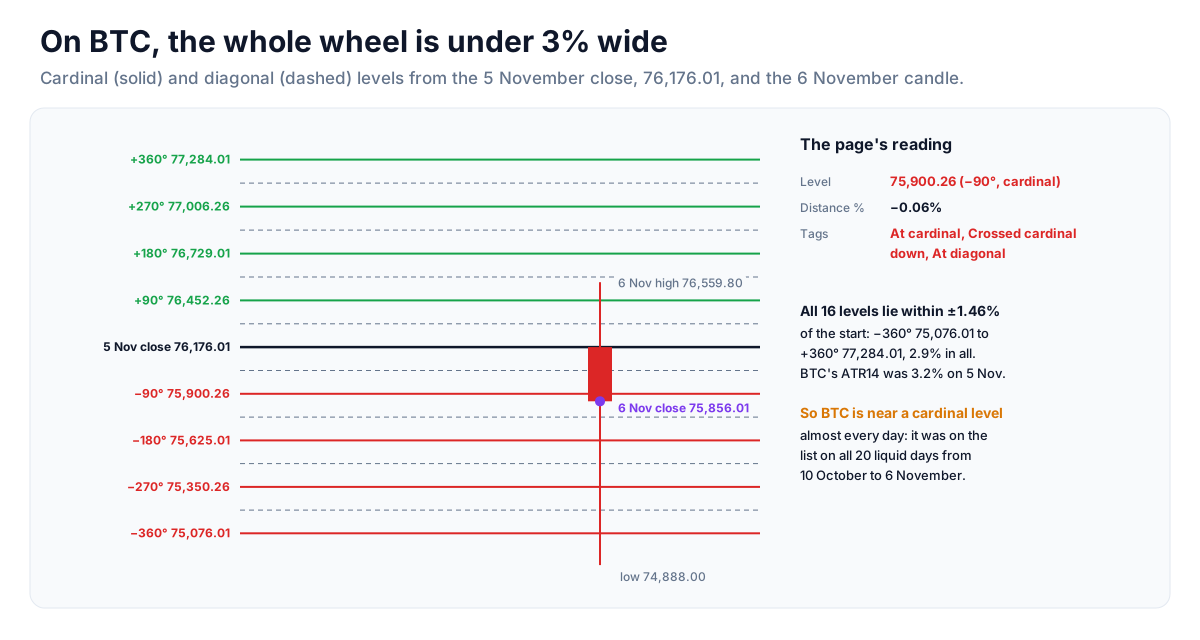
- The start: the 5 November close, 76,176.01.
- Cardinal levels: −90° 75,900.26, −180° 75,625.01, −270° 75,350.26, −360° 75,076.01 below; +90° 76,452.26 up to +360° 77,284.01 above.
- The day: BTC slipped 0.42% to 75,856.01, 0.06% below the −90° level. Tags: At cardinal, Crossed cardinal down (it closed through −90°), and At diagonal (the −45° level at 76,038.07 is within 0.5% too).
- The reading: a 0.42% day earned three tags. On BTC that is what the page normally shows; it is not a strong signal on its own.
ETHUSDT, 4 November: a cardinal level that meant more
- The start: 2,295.96. ETH's cardinal levels are about 2% apart.
- The day: ETH rose 5.97% to 2,433.12 and closed through +90° and +180° to sit 0.36% under the +270° level at 2,441.96. Tags: At cardinal and Crossed cardinal up.
- The reading: three quarters of a turn of the square in one day, ending right at a cardinal level. That is the kind of row the page exists to find.
BNB gave a quieter example the next day: on 5 November it fell 3.50% to 693.25, 0.20% above its −90° cardinal at 691.84, and was tagged At cardinal.
How to use it in a trade
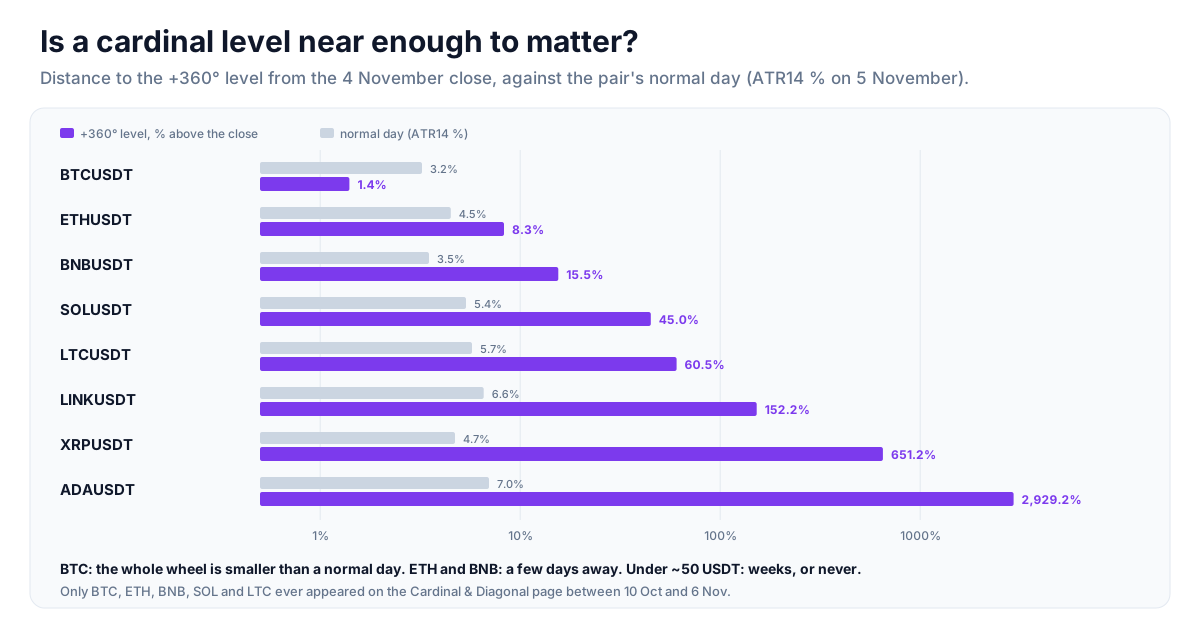
- Check which pair you are looking at. For BTC, ignore plain At cardinal and At diagonal; look only at crosses of the 270° and 360° levels. For ETH and BNB, every tag is worth a look.
- Read the degree. The Degree column says how far around the square the close is from yesterday. +270° or −270° in a day is a large move for ETH; for BTC it is about 1%.
- Prefer cardinal to diagonal. Diagonal levels are the weaker set and sit between the cardinal ones.
- Wait for the next close. A cardinal level that holds on the next daily close is a reference; one that is lost again within a day was just passed through.
Strategy ideas (ideas, not promises)
These are ideas to study, paper-trade and backtest, not recommendations or signals, and not a promise of any result. Every condition below can fail. Crypto trades around the clock and can move sharply at any hour; leverage and options can lose more than you expect, and past behaviour says nothing certain about the next session. Size, entries, exits and risk are your own decisions.
1. ETH or BNB at a cardinal after a big day
- Setup: At Cardinal plus Crossed Cardinal on ETH or BNB, like ETH at +270° on 4 November.
- Idea: treat the level as a reaction point: a hold above it on the next close keeps the move going towards the next cardinal; a close back below the crossed level undoes it.
2. BTC's full turns only
- Setup: BTC with Crossed Cardinal at ±270° or ±360°, or no "At" tag at all, which means the close went beyond the 360° band.
- Idea: those are BTC's large days by Gann's measure. Study what followed them; skip the everyday At tags.
3. Combine with the swing chart
A pair that turns on the swing chart on the same day it sits at a cardinal level has price structure and a Gann level agreeing; see the crypto Swing Chart guide.
How to test these
List past days with ETH or BNB at or through a cardinal level and record the next three closes against that level. Run BTC as a separate test, counting only the 270° and 360° crosses.
Risk per trade - risk a small, fixed share of capital on any one idea. Crypto never closes, so a stop is the only exit while you sleep; with leverage, keep the liquidation price well beyond the stop. When selling options, prefer defined-risk structures (spreads, iron condors) over naked positions.
Test before you trade - write the rules down exactly, test them on past data (see how to backtest an options strategy and the Option Simulator, which supports crypto), then paper-trade at least 20 occurrences before committing real money. Keep a journal of every trade, including the ones you skipped.
Every tab and column
- Tabs - All (any tag), At Cardinal, Crossed Up, Crossed Down, At Diagonal. Sorted by distance to the nearest level.
- Level - the cardinal or diagonal level nearest the close.
- Degree - its angle from yesterday's close; minus means below.
- Distance % - (close − level) ÷ level.
- Tag - every list the pair is on today.
- Chart - the cardinal levels (solid) and diagonal levels (dashed) around yesterday's close, with the nearest highlighted. Click a row for the Gann Wheel, which shows the same idea as a circle.
What the numbers are built from
- Pairs. The live USDT pairs in Unfluke's crypto archive (34 on 8 November 2026). A pair whose 20-day average range is under 0.25% of price is not scanned, which is meant to keep stablecoins out; after a few wide wicks in late October 2026, USDCUSDT was briefly back on some lists.
- Liquidity first. A pair is listed only if its 20-day average turnover is above US$500,000, today's turnover above US$100,000, and today's volume above 0.8× the average of the previous 20 days. There is no circuit rule; crypto has no price bands.
- Days. Daily candles are IST calendar days, 00:00 to 23:59, rolled up from the one-minute Binance spot archive. Everything is end of day, and the newest day is topped up during the day, so it can be partial until 23:59 IST.
- Quiet days empty the page. The volume rule compares a day with the 20 before it, and weekends trade less. On Saturday 7 November 2026 one pair passed; on Sunday 8 November none did, so every Gann page was empty. Signed-in users can pick an earlier session date.
- Universe. All, Futures (pairs with a perpetual future in the archive) or Options (BTC and ETH).
- Look-back. The swing-based pages read about 400 days of history. One extreme candle, such as the crash of 10 to 11 October 2025 when several altcoins printed lows near zero on Binance, stays in that window for over a year and can dominate the swings measured from it. If a row's swing dates point at a crash day, read it with care.
Gann levels, angles and cycles are research references. They describe geometry on a price chart, not a forecast, and prices move through them regularly.
Where to go next
Open the page at Gann → Cardinal & Diagonal (switch the market to Crypto). The NSE version is explained in the Gann Cardinal & Diagonal guide.
The other crypto Gann guides: Swing Chart, Square of 9 Levels, Level Cross, Degree Levels. For floor pivots on the same pairs, read the crypto pivot points guide; for a day's unusual volume, the crypto Volume Shockers guide. Sign up free to open the Market Terminal.
More from the blog
- Strategy Backtesting on Unfluke
Backtest trading strategies on real Indian market data with Unfluke. Test equity, Nifty, Bank Nifty and options strategies with realistic costs and key metrics.
- Live Market Scanners
Explore Unfluke's real-time stock scanner for NSE markets. Scan 1,800+ stocks with 40+ technical indicators, fundamental filters, F&O data and custom rules.
- Option Strategy Simulator
Build and simulate multi-leg options strategies with Unfluke. Visualize payoffs, Greeks, max profit and loss, and replay historical option data from 2023.