Crypto
Crypto Volume Shockers: USDT Pairs Trading Far Above Their Usual Volume
10 min read · Updated 9 Nov 2026
Crypto never closes, so there is no opening bell to mark when something has changed. Volume does that job. When a coin trades ten times its usual amount in a day, a lot of people have acted on something at once: a listing, an unlock, a hack, a liquidation cascade, or a story the whole market is chasing. The volume does not say which, or whether the move will last, but it is one of the clearest signs that a pair deserves a look today.
The crypto Volume Shockers page lists every live USDT pair whose daily volume was at least twice its usual, with the day's move and the distance from its high beside it. This guide explains the measure, works through two real days (HBARUSDT on 28 September 2026 and the market-wide sell-off of 30 October 2026), and shows how to tell a one-coin shock from a whole-market one.
What a volume shock is, and how the page measures it
The multiple: Vol × Avg
The page divides a day's volume by the average volume of the 20 days before it:
Vol × Avg = the day's volume ÷ average volume of the previous 20 days
Volume is counted in units of the coin (HBAR, BTC, ETH), not in USDT, so a price jump does not inflate it. The day itself is left out of its own average: if it were included, HBAR's 9.49× day would have read as about 6.6×. A day is the IST calendar day, 00:00 to 23:59, as everywhere on the crypto side of Unfluke.
A ratio is used rather than raw volume because pairs differ by orders of magnitude. A day that is busy for HBAR would be a quiet hour for BTC. Measured against its own average, every pair is on the same scale.
One thing the average does after a shock
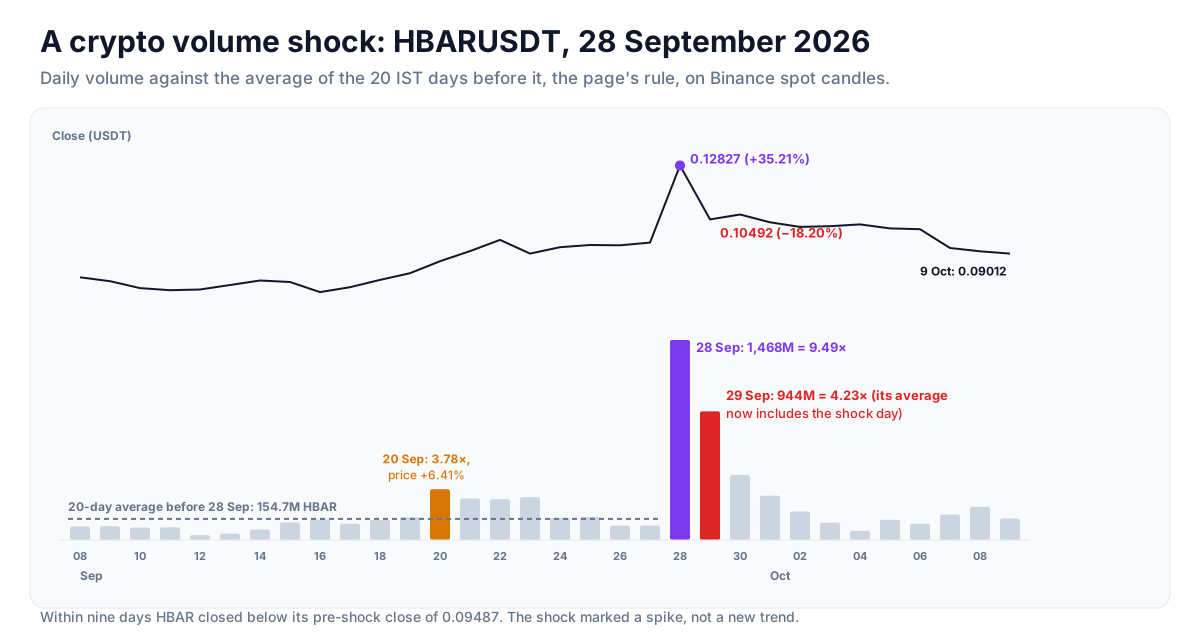
Once a shock day is in the past, it sits inside the next 20 days' average and lifts it. HBAR's 29 September volume of 944 million was six times its pre-shock average, but the page reads it as 4.23×, because the 1,468-million day is now part of the yardstick. For about four weeks after a big shock, the same pair needs more volume to register again.
Which pairs are scanned
- Live USDT pairs in Unfluke's crypto archive, with a 20-day average turnover above US$500,000 (the day itself included in that average).
- Stablecoins are left out by behaviour, not by name: a pair whose average daily range is under 0.25% does not move enough for any scan to say anything about it. The rule is not airtight: a few stray wicks can lift a stablecoin's 20-day average range just over the line, and in early November 2026 USDCUSDT's did, so it showed up on the lists for a while. Ignore it if you see it.
- A pair that traded under US$100,000 in the day is left out as untraded.
Two real days: one coin, then the whole market
On the newest day when this guide was written, Sunday 8 November 2026, the page read 33 live pairs and listed none at 2× or more: a quiet day, which is normal. The two examples below are earlier days, worked out with the page's rule from Binance spot candles grouped into IST days. Unfluke's archive is Binance data, so the page's own figures for those days should be the same or very close.
HBARUSDT, 28 September 2026: a one-coin shock
- Vol × Avg 9.49×: 1,468 million HBAR against a 20-day average of 154.7 million.
- Price +35.21%, from 0.09487 to 0.12827, with a high of 0.13096.
- About US$169 million traded in the day, against an average of US$13.2 million a day over the 20 days before.
On 28 September only three other pairs in a 29-coin sample traded above 1.8× (LINKUSDT 2.61×, XLMUSDT 2.29×, SUIUSDT 1.83×), and none came near 9×. This was HBAR's own story, not the market's. What came next is the lesson: on 29 September HBAR fell 18.20% to 0.10492 on 4.23× its (now inflated) average, and by 7 October it closed below its pre-shock close. The volume shock marked a spike that was sold, not the start of a trend. Both days clear the page's 2× bar; only the days after could tell the spike from a trend.
30 October 2026: a whole-market shock
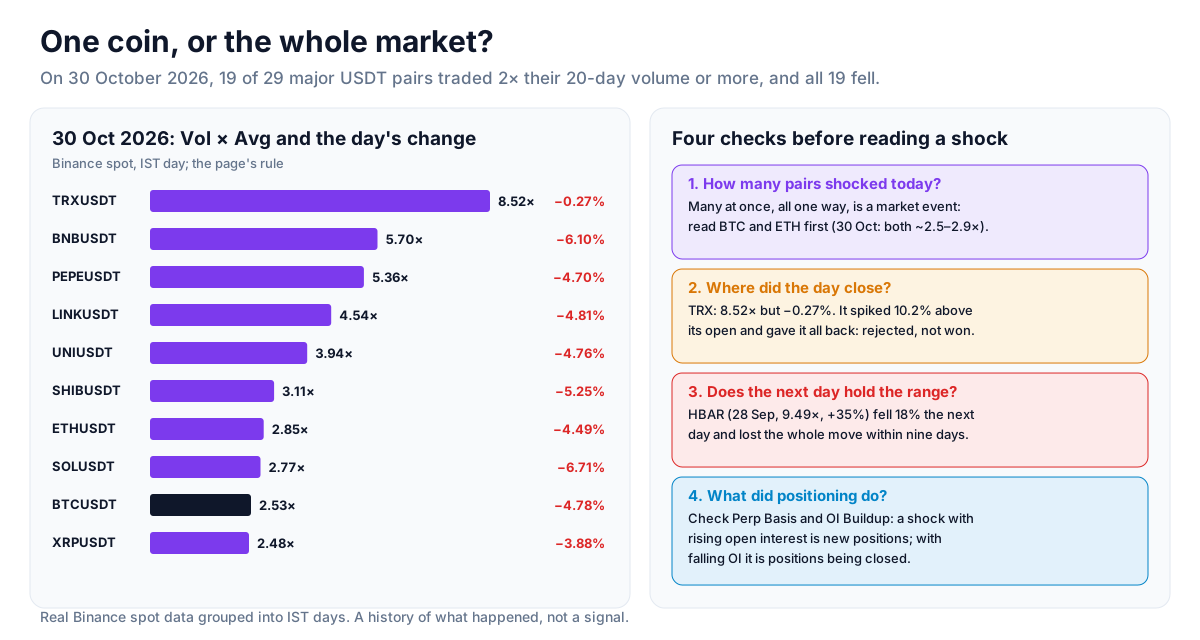
On 30 October, 19 of the same 29 large USDT pairs traded at least 2× their 20-day average, and all 19 closed lower:
- BTCUSDT 2.53×, −4.78% (80,784 to 76,918.91).
- ETHUSDT 2.85×, −4.49%; SOLUSDT 2.77×, −6.71%; BNBUSDT 5.70×, −6.10%.
- TRXUSDT 8.52×, −0.27%: the biggest multiple of the day, on almost no change.
When most of the list shocks at once, in the same direction, the shock is the market. Reading each coin's row as its own story would miss that. Start with BTC and ETH, and treat the altcoin rows as the same event at a larger size.
TRX is the interesting exception. Its open was 0.3315; during the day it traded as high as 0.3654, 10.2% above the open, then closed at 0.3306. Eight and a half times its usual volume, a 10% spike, and nothing to show for it at the close: the spike was sold in full.
How to use it in a trade
A step-by-step way to go from a row to a plan:
- Count the rows. One or two shockers on a quiet day are coin stories. A long list, mostly in the same direction, is a market story. Check BTCUSDT and ETHUSDT before anything else.
- Pick the side. Use the Price Up or Price Down tab so rising and falling shocks are not mixed together.
- Read where the day closed. Open the chart. A close near the day's high (HBAR on 28 September) is a different day from a 10% spike handed back by the close (TRX on 30 October). The second is a rejection, whatever the volume.
- Find the reason. Exchange listings, token unlocks, protocol news, hacks and liquidation cascades are the usual causes. A shock with no visible reason deserves more caution, not less.
- Check positioning. The Perp Basis Scanner shows whether the perpetual swung to a premium or a discount, and OI Buildup whether open interest rose (new positions) or fell (positions being closed, often forced).
- Let the next day speak. A breakout that holds above the shock day's low for the next few days is confirming; one that gives back the shock day's range, as HBAR did, is not.
Risk per trade - risk a small, fixed share of capital on any one idea. Crypto never closes, so a stop is the only exit while you sleep; with leverage, keep the liquidation price well beyond the stop. When selling options, prefer defined-risk structures (spreads, iron condors) over naked positions.
Strategy ideas (ideas, not promises)
These are ideas to study, paper-trade and backtest, not recommendations or signals, and not a promise of any result. Every condition below can fail. Crypto trades around the clock and can move sharply at any hour; leverage and options can lose more than you expect, and past behaviour says nothing certain about the next session. Size, entries, exits and risk are your own decisions.
1. Fade the spike that was handed back
- Setup: a pair at 5× or more whose day traded far above the open but closed near or below it (a long upper wick, like TRX on 30 October).
- Idea: treat the spike's high as a level sellers defended. A later rally that stalls below it is the setup to study for a short; a daily close above it cancels the idea.
2. One-coin breakout that holds
- Setup: a single pair on the Price Up tab, at 3× or more, near its high, on a day when the rest of the list is quiet.
- Idea: wait for the next one to three days. If the price holds above the shock day's midpoint on falling volume, the move is being accepted; if it gives back half the shock day or more (HBAR on 29 September), stand aside.
- Invalidation: a daily close below the shock day's low.
3. Market-wide flush, majors first
- Setup: a day like 30 October, with most pairs shocked lower together.
- Idea: watch BTCUSDT and ETHUSDT for a close back above the flush day's midpoint. Altcoins usually follow the majors in such moves, with larger swings, so the majors are the cleaner read; size altcoin ideas smaller.
- Check: open interest falling sharply on the flush day means leveraged longs were closed. That is fuel used up, not fresh selling.
Test before you trade - write the rules down exactly, test them on past data (see how to backtest an options strategy and the Option Simulator, which supports crypto), then paper-trade at least 20 occurrences before committing real money. Keep a journal of every trade, including the ones you skipped.
Every tab, filter and column
The tabs
- All Shockers - every pair at or over the chosen multiple, biggest multiple first.
- Price Up - the shock came on a day the pair closed higher.
- Price Down - the shock came on a day it closed lower.
- Near 52W High - closed within 5% of its high (see the note on crypto's "52 weeks" below).
The filters
- Volume at least - 2× (the default), 3× or 5× the 20-day average.
- Date - the newest IST day by default; signed-in users can pick an earlier one.
- Universe - All, Futures or Options (pairs that have a perpetual future, or options, in Unfluke's archive).
The columns
- Symbol, LTP - the pair, its close and the day's change.
- Vol × Avg - the day's volume ÷ the average of the 20 days before it; highlighted at 5× or more.
- Volume - units of the coin traded in the day.
- 20D Avg Vol - the average of the 20 days before.
- From 52W High - the close against the highest high of the look-back; 0% is at the high.
- Avg Turnover - average traded value of the last 20 days, in US$.
- Signal - Price up, Price down, Near 52W high. (Crypto has no price bands, so the Circuit tag never appears.)
- 5 Days - the last five daily candles.
- Chart - the daily candles with the shock day marked.
The NSE version of the page also shows the sector and the delivery %. Crypto has neither: there is no delivery settlement on an exchange order book.
What the numbers are built from, and what they cannot tell you
The daily bars are rolled up from Unfluke's one-minute spot archive (Binance data) into IST days, 00:00 to 23:59. Volume is the base coin's quantity; turnover is price × volume, in USDT.
- One exchange. Volume on other exchanges can tell a different story, especially for a coin whose shock came from a listing elsewhere.
- Spot only. Perpetual futures volume is often several times spot volume and is not part of this count. Liquidations happen in futures; spot volume shows only the selling or buying they set off.
- "52 weeks" is 252 days here. The high is read over the last 252 daily bars, the same count as a trading year on NSE. Crypto trades every day, so on crypto that is about eight months, not a calendar year, and Near 52W High needs 252 days of history.
- The newest day can be unfinished. The daily bars are topped up during the day, so the newest day's volume is partial until 23:59 IST. A pair can cross 2× in the evening that was not on the list in the morning; for a like-for-like reading, use finished days.
Where to go next
For positioning behind a shock, read the Perp Basis guide and the OI Buildup guide; for funding and long/short ratios on BTC and ETH, the Binance Futures guide; for the day's breadth, the Advance Decline guide. The NSE version is explained in the Volume Shockers guide. Open the page at Watch List → Volume Shockers (switch the market to Crypto), or sign up free to open the Market Terminal.
More from the blog
- Strategy Backtesting on Unfluke
Backtest trading strategies on real Indian market data with Unfluke. Test equity, Nifty, Bank Nifty and options strategies with realistic costs and key metrics.
- Live Market Scanners
Explore Unfluke's real-time stock scanner for NSE markets. Scan 1,800+ stocks with 40+ technical indicators, fundamental filters, F&O data and custom rules.
- Option Strategy Simulator
Build and simulate multi-leg options strategies with Unfluke. Visualize payoffs, Greeks, max profit and loss, and replay historical option data from 2023.