Crypto
Crypto Inside Bar Scanner: Mother Bars, WR10 and NR7 ID on USDT Pairs
10 min read · Updated 9 Nov 2026
An inside bar is a day whose high and low both sit inside the previous day's. The bigger day is the mother bar; the small one inside it is the market pausing to absorb the move. Traders mark the mother bar's high and low and watch which one breaks. The Inside Bar page lists every such day, tags the strongest kinds, and on the next day shows which broke out with volume.
The rules are those of the NSE Inside Bar page. On crypto the mother bars are much wider, often 10% to 25%, and inside bars tend to appear across the whole market at once after a big day. This guide follows FILUSDT from its mother bar on 18 August 2026 to the breakout and what came after, and looks at 23 August, when 18 pairs were inside bars together.
The rules
The inside bar
- Inside bar: the day's high is strictly below the previous day's high, and its low strictly above the previous day's low.
- Mother bar: the previous day. Its high and low are the levels to watch.
The two tags
- WR10: the mother bar has the widest range of the last 10 days. A big move followed by a pause, the most common inside bar on crypto.
- NR7 ID: the inside bar is also the narrowest day of the last 7. A tight pause inside a range; the stop can be small.
A row can carry both. The plain "Inside Bar" tab shows only those with neither tag.
The follow-up
- Triggered Up: the day after an inside bar closes above the mother bar's high, on volume above 1.3× the 20-day average.
- Triggered Down: closes below the mother bar's low on the same volume.
The follow-up tabs show yesterday's inside bars only and drop off after one day. The break is judged on the 23:59 IST close.
What is different on crypto
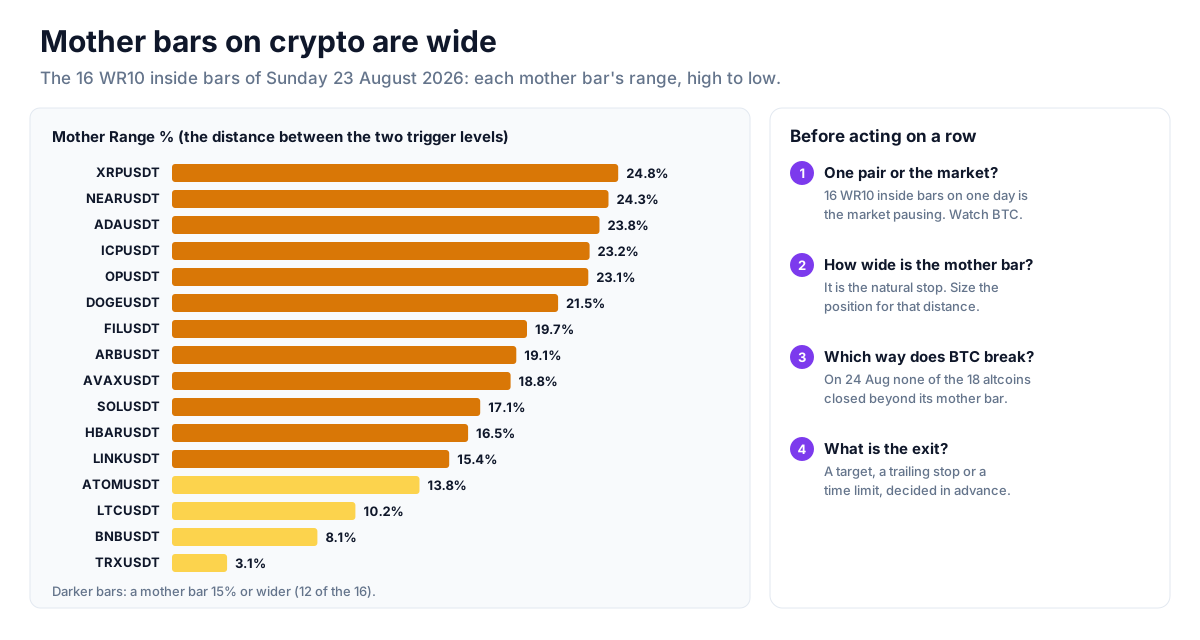
- Mother bars are wide. On 23 August 2026 the mother bars ranged from 3.1% (TRXUSDT) to 24.8% (XRPUSDT). The distance from mother high to mother low, which is the natural stop, can be bigger than a whole NSE swing. The Mother Range % column shows it before you plan anything.
- Ten days and seven days include weekends, so a quiet Sunday inside a busy Saturday is a common inside bar with little meaning.
- Inside bars cluster. After a market-wide move, many pairs pause on the same day.
Real days: FILUSDT in August, and the 23 August cluster
How these examples were worked out: signed-out visitors can open only the newest day on the page, so the earlier days below come from Unfluke's own scanner code run on Binance spot candles grouped into IST days. Unfluke's crypto archive is Binance data, and for 8 November 2026, the newest day the page showed when this was written, the two agree exactly. The page's own figures for the earlier days should be the same or very close.
FILUSDT: WR10 inside bar on 19 August 2026
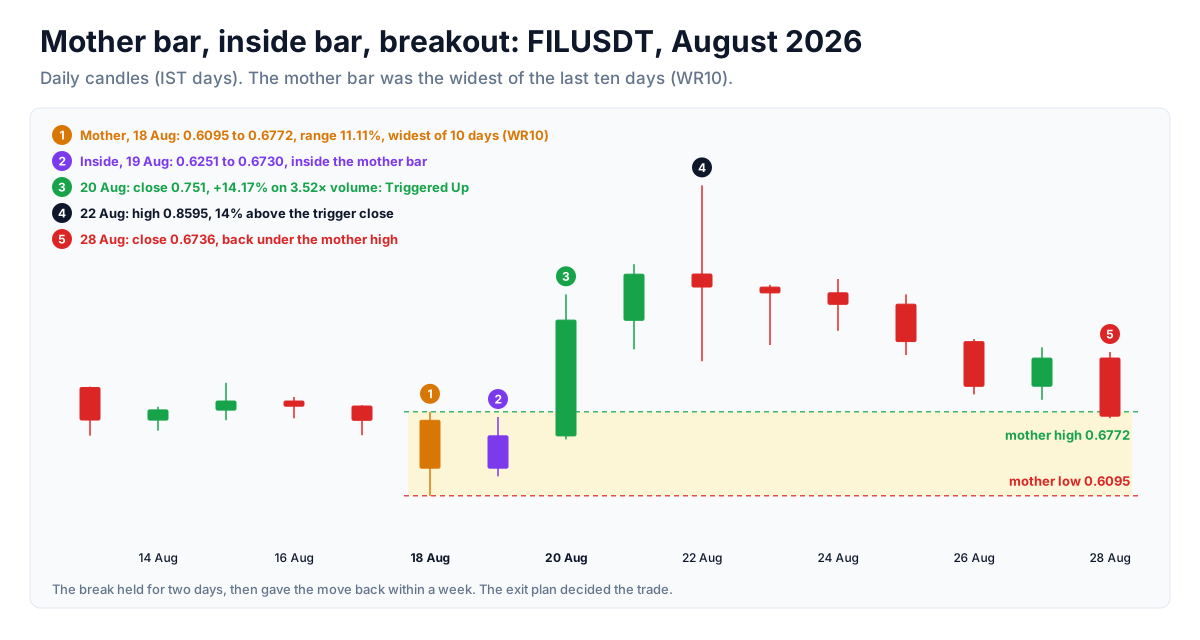
- Mother bar, 18 August: high 0.6772, low 0.6095, a range of 11.11% and the widest of FIL's last ten days. FIL fell 5.8% that day.
- Inside bar, 19 August: high 0.6730, low 0.6251, close 0.6578. The inside day used about 71% of the mother bar's range: a pause, not a squeeze.
- Follow-up, 20 August: FIL closed at 0.751, above the mother high, up 14.17% on 3.52× average volume. Triggered Up.
What followed: FIL reached a high of 0.8595 on 22 August (14% above the trigger close), then slid. On 28 August it closed at 0.6736, just under the mother high, having given back the whole breakout in a week. A stop at the mother low (0.6095) was never reached, and FIL went on to a close of 1.16 on 26 September. Whether this was a good trade depended entirely on the exit plan.
23 August 2026: 18 inside bars on one day
On 21 August BTC rose to 79,500, its range 9.3%; on 22 August many altcoins had their widest day in weeks. On Sunday 23 August, 18 of the 31 liquid pairs were inside bars, and 16 of them were WR10. Most of the mother bars were 15% to 25% wide (SOLUSDT 17.1%, NEARUSDT 24.3%, XRPUSDT 24.8%).
When most of the market forms an inside bar on the same day, the pause is the market's. The useful question is which way BTC resolves it. On 24 August BTC closed at 79,013.99 on 1.96× volume, above its narrow Sunday range but still below its 21 August high of 79,500. None of the 18 altcoins closed beyond its mother bar that day, so none reached the follow-up tabs: a market-wide pause can resolve slowly.
Three months of follow-ups
From 1 August to 1 November 2026 the page would have shown 31 follow-ups. Three days later, 19 had closed further in the breakout direction, and 10 had closed back through the mother level at least once in those three days. A small sample; it says the pattern is not a signal on its own, and that the next few days matter as much as the break.
How to use it in a trade
- Count the inside bars. One or two on a busy day are coin stories; a dozen on the same day, especially after a large market move, is the market pausing. Watch BTCUSDT's mother bar first.
- Read Mother Range %. It is the distance between the two trigger levels and the natural stop. If it is 20%, a position sized for a 3% stop is far too big.
- Prefer NR7 ID for a tight stop. The inside day's own range (Inside Range % shows it as a share of the mother bar) can serve as a smaller stop, at the cost of more false breaks.
- Use the trend filter. Above 20 EMA for upside breaks in uptrends, Below 20 EMA for downside breaks in downtrends.
- Plan the exit before the entry. FIL's breakout gained 14% in two days and lost it in the next five. A target, a trailing stop or a time limit decides the outcome more than the entry.
Risk per trade - risk a small, fixed share of capital on any one idea. Crypto never closes, so a stop is the only exit while you sleep; with leverage, keep the liquidation price well beyond the stop. When selling options, prefer defined-risk structures (spreads, iron condors) over naked positions.
Strategy ideas (ideas, not promises)
These are ideas to study, paper-trade and backtest, not recommendations or signals, and not a promise of any result. Every condition below can fail. Crypto trades around the clock and can move sharply at any hour; leverage and options can lose more than you expect, and past behaviour says nothing certain about the next session. Size, entries, exits and risk are your own decisions.
1. WR10 continuation
- Setup: a WR10 inside bar where the mother bar moved in the direction of the trend (a big up day above the 20 EMA).
- Idea: study a daily close beyond the mother bar in the trend's direction on volume above 1.3×, with the stop at the mother bar's midpoint rather than its far side.
- Exit: a fixed multiple of the stop distance, or a trailing stop under each new daily low.
2. NR7 ID with a tight stop
- Setup: an NR7 ID row with Inside Range % below about 40%.
- Idea: enter on a close beyond the inside bar, not the mother bar, with the stop on the other side of the inside bar. More false starts, much smaller losses each time.
3. Market-wide pause: let BTC decide
- Setup: a day with ten or more inside bars, BTCUSDT among them or close to it.
- Idea: study trading altcoins only in the direction BTC breaks its own mother bar, starting with the pairs whose mother bars are narrowest.
Test before you trade - write the rules down exactly, test them on past data (see how to backtest an options strategy and the Option Simulator, which supports crypto), then paper-trade at least 20 occurrences before committing real money. Keep a journal of every trade, including the ones you skipped.
Every tab, filter and column
The tabs
- All - every inside bar today, the tightest (lowest Inside Range %) first.
- Inside Bar - plain inside bars, without the WR10 or NR7 ID tag.
- WR10 - the mother bar is the widest of the last 10 days.
- NR7 ID - the inside bar is also an NR7.
- Triggered Up / Triggered Down - yesterday's inside bar; today closed beyond the mother bar on volume above 1.3×.
The filters
- Trend context - Any, Above 20 EMA or Below 20 EMA.
- Date and Universe (All, Futures, Options) - for signed-in users.
The columns
- Mother High, Mother Low - the trigger levels.
- Mother Range % - (mother high − mother low) ÷ mother low.
- Inside Range % - the inside day's range as a share of the mother bar's.
- 20 EMA, ADX, ATR %, Vol ratio - trend position, trend strength, normal movement and participation.
- Tags - Inside, WR10, NR7 ID, and the follow-up direction.
- 5 Days, Chart - the last five candles, and the daily chart with the mother bar marked.
What the numbers are built from, and what they cannot tell you
Which pairs are read
- Live USDT pairs in Unfluke's crypto archive: 33 were scanned on 8 November 2026, from BTCUSDT and ETHUSDT to small pairs such as SOLVUSDT and GALAUSDT. A pair whose feed has stopped for three days is no longer live, and one that traded under US$100,000 in the day is left out as untraded.
- Flat pairs are left out by behaviour, not by name. A pair whose average daily range over 20 days is under 0.25% is a stablecoin in practice, and no momentum measure means anything on it.
- Liquidity first: a 20-day average turnover above US$500,000 (the day itself included) and the day's volume above 0.8× the average of the 20 days before it.
- No circuit rule. Crypto has no price bands, so nothing is left out for hitting one.
- No sector column and no "Indices" universe. The universe box offers All, Futures and Options: the pairs that have a perpetual future, or options, in Unfluke's archive.
What to keep in mind
Weekends empty the lists. Crypto trades on Saturday and Sunday, but far fewer people trade. From August to early November 2026, BTCUSDT's weekend volume was typically about half its 20-day average (a median of 0.48×), so most pairs fail the 0.8× volume rule. Across those 100 days a median of 21 pairs passed on a weekday and 6.5 on a weekend; on Sunday 8 November none did, and every momentum list was empty. An empty weekend page is the rule doing its job, not a fault.
The daily bars are rolled up from Unfluke's one-minute spot archive (Binance data) into IST days, 00:00 to 23:59. Volume is the coin's quantity; turnover is price × volume, in USDT. RSI 14 and ADX 14 use Wilder's smoothing, ATR is 14 days, and the EMAs are on the close, from the same library as the RSI and ADX scans, so a value here matches the value on those pages.
- Days are calendar days. Crypto has no holidays, so "10 to 40 days" or "the last 7 sessions" counts Saturdays and Sundays too. Seven sessions on crypto is one week; on NSE it is about a week and a half.
- The newest day can be unfinished. The daily bars are topped up during the day, so until 23:59 IST the newest day's range and volume are partial. A partial day usually fails the 0.8× volume rule, and its range looks narrower than it will end up. For a finished reading, use the previous day (signed-in users can pick the date).
- One exchange, spot only. Perpetual futures often trade several times the spot volume and are not counted. A move driven by futures liquidations shows up here only through the spot buying or selling it set off.
- A stablecoin can slip through. The flat test averages the daily range over 20 days. A few one-minute spikes on a stablecoin can lift that average over 0.25%: USDCUSDT had spikes of 2.1% on 21 October and about 0.9% on 26 and 27 October, and from 5 November 2026 it passed the test. Its ADX then reads above 80 and it can rank on Momentum Rank. If you see USDCUSDT or another stablecoin on a list, ignore it.
Where to go next
For the closest relative of this pattern, read the NR4 & NR7 guide; for trend setups, the Pullback Continuation guide; for candle patterns in general, the Candlestick Patterns guide. The NSE version is explained in the Inside Bar guide. Open the page at Watch List → Inside Bar (switch the market to Crypto), or sign up free to open the Market Terminal. Signed-out visitors see the default view of the newest day; signing in unlocks the tabs, filters, universe and date.
More from the blog
- Strategy Backtesting on Unfluke
Backtest trading strategies on real Indian market data with Unfluke. Test equity, Nifty, Bank Nifty and options strategies with realistic costs and key metrics.
- Live Market Scanners
Explore Unfluke's real-time stock scanner for NSE markets. Scan 1,800+ stocks with 40+ technical indicators, fundamental filters, F&O data and custom rules.
- Option Strategy Simulator
Build and simulate multi-leg options strategies with Unfluke. Visualize payoffs, Greeks, max profit and loss, and replay historical option data from 2023.