Crypto
Crypto Retracement and OTE: The 62–79% Pullback After a Break of Structure
12 min read · Updated 9 Nov 2026
After a strong move and a break of structure, price usually gives part of the move back before the next leg. How deep should that pullback go before you act on it? ICT's answer is the optimal trade entry (OTE): the band between 62% and 79% of the leg, with 70.5% in the middle.
The crypto Retracement / OTE page measures the leg of each liquid USDT pair's newest break and lists the pairs pulling back into, near or beyond that band. This guide explains the levels and the rule, reads LINKUSDT's bearish OTE of 4 November 2026 and UNIUSDT's bullish one of 6 November, does the arithmetic of two stop choices, and shows a weekly leg on LTC.
What a retracement and the OTE band are
A retracement is a pullback measured as a share of the move before it. Traders mark the Fibonacci ratios (38.2%, 50%, 61.8%, 78.6%) because pullbacks often pause near them; nothing makes them hold. ICT narrowed this to one band after a break of structure: 61.8% to 78.6% of the leg that made the break, which the page rounds to 62% and 79%, with 70.5% as the middle.
The rule the page uses
- The break - the pair's newest BOS or CHoCH, no more than 30 days old.
- The leg - for a bearish break, from the highest high between the broken swing low and the breaking candle (the leg's start) to the lowest low since the break (its end). Bullish the mirror.
- Big enough - at least 2 × ATR 14. Crypto's daily ATR is large, so this already asks for a real move.
- A pullback has started - if the day shown made the leg's new extreme, there is nothing to measure yet.
- Still alive - a close beyond the leg's start ends it.
The three states
- In OTE - the day's high (bearish leg) or low (bullish leg) reached at least 62% of the leg, and the close stayed inside the 79% edge.
- Approaching - the close is between 50% and 62%.
- Deep - the high or low went past 79% but the close stayed inside the leg's start.
Real rows: LINKUSDT and UNIUSDT
How these examples were made: the page's newest day for visitors who are not signed in was Sunday 8 November 2026, which listed no pairs (see "Weekends" below), and past dates need a free sign-in. So the rows here come from running the page's own rules (the same backend functions) on Binance spot candles grouped into IST days, the source of Unfluke's crypto archive. The page's own numbers can differ slightly where its minute archive has a gap.
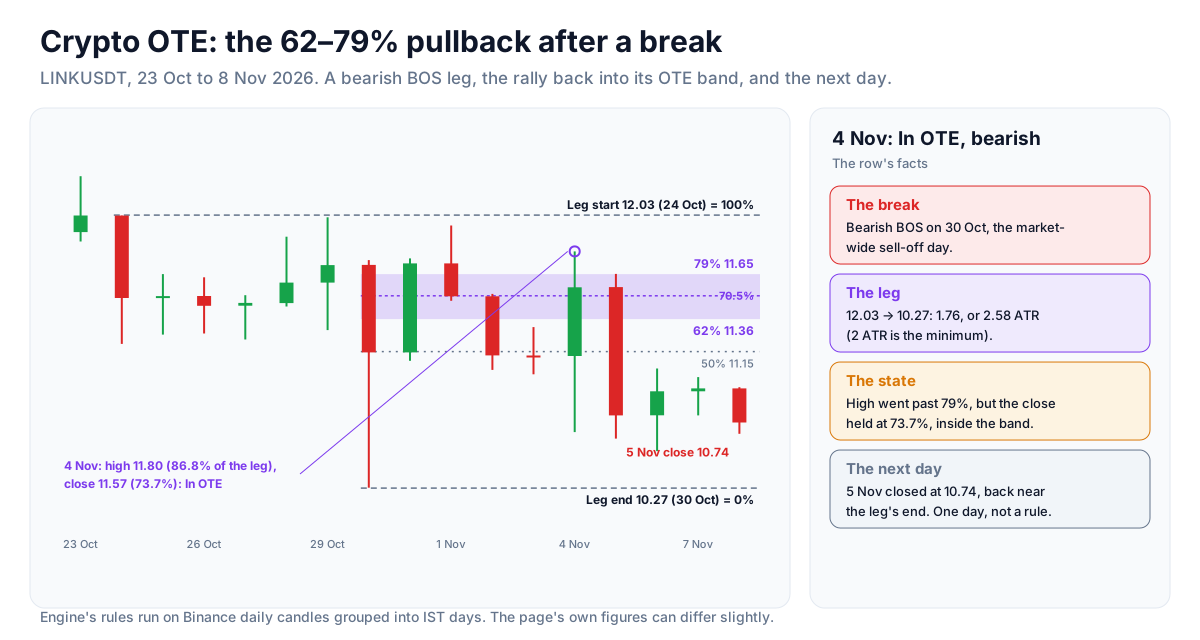
LINKUSDT: In OTE Bearish, 4 November
- The break: a bearish BOS on 30 October, the market-wide sell-off day.
- The leg: from 12.03 (24 October) down to 10.27 (30 October), 1.76 or 2.58 ATR.
- The levels: 50% at 11.15, 62% at 11.36, 70.5% at 11.51, 79% at 11.65.
- 4 November: the rally's high reached 11.80, which is 86.8% of the leg, past the 79% edge; but the close of 11.57 sat at 73.7%, back inside the band. By the rule that is In OTE.
- 5 November: the high touched 11.65 (78.6%) again and the day closed at 10.74, 26.6% of the leg, down 7%.
Through 8 November LINK did not reach the leg's end (its lowest was 10.51 on 6 November) and closed at 10.69. The band marked where sellers came back in; it did not say how far they would push.
UNIUSDT: In OTE Bullish, 6 November
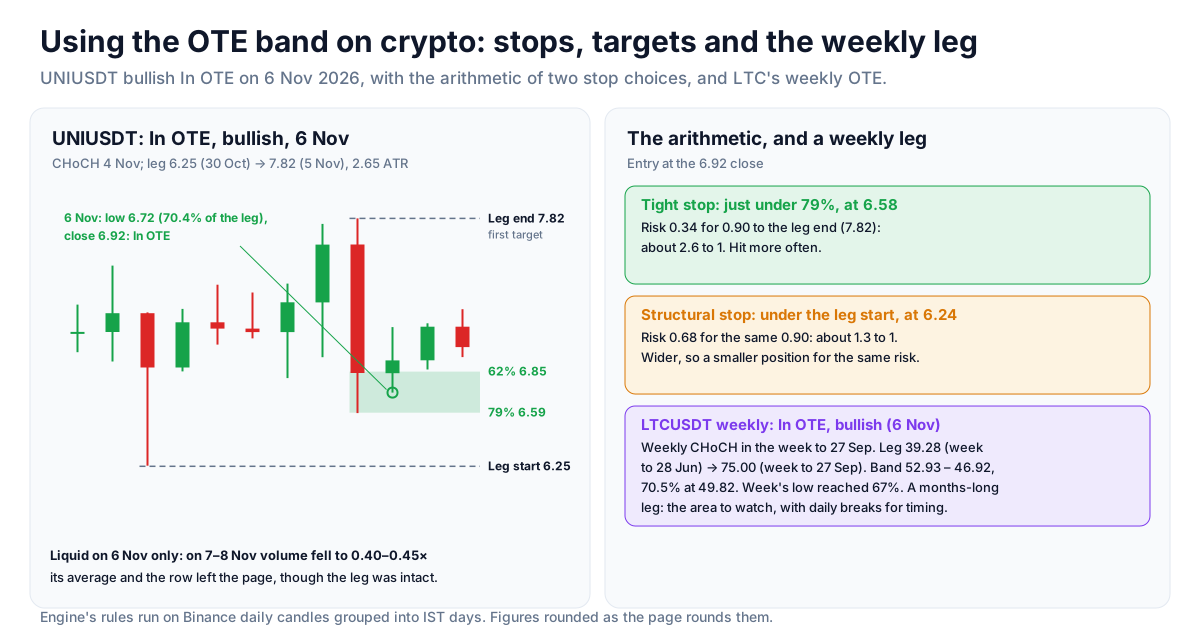
- The break: the bullish CHoCH of 4 November above 7.52.
- The leg: from 6.25 (30 October) to 7.82 (the 5 November spike), 2.65 ATR.
- The levels: 62% at 6.85, 70.5% at 6.72, 79% at 6.59.
- 6 November: the low reached 6.717, 70.4% of the leg, almost exactly the middle line, and the close of 6.921 came back up to 57.4%.
The row was on the page only that day: on 7 and 8 November UNI's volume was 0.40 and 0.45 times its average, under the liquidity gate, though the leg was intact (8 November close 7.005).
Two more states from the same days
- XRPUSDT, Deep Bearish on 4 November: after its 30 October CHoCH (leg 1.34 to 1.20), the rally reached 97.9% of the leg and closed at 79.8%. On 6 November XRP closed under 1.20, a new bearish BOS: the deep pullback held, just.
- INJUSDT, Deep Bearish on 5 and 6 November: the high went beyond the leg's start (8.30) and the close on 6 November sat at 99.5%, a hair inside it. One more close above 8.30 would have ended the leg.
How to use the OTE band in a trade
- Start from the break. A CHoCH leg is a possible new trend, a BOS leg a continuing one; check BTC's structure too.
- Mark the band in advance. 62% and 79% are the edges; 70.5% (on the chart pop-up) the middle.
- Wait for price to hold. A close back out of the band in the leg's direction is the minimum; a fair value gap or order block inside the band adds a reason.
- Choose the stop. Tight: just beyond 79%. Structural: beyond the leg's start, which is also where the page drops the leg.
- Do the arithmetic. For UNI, entering at the 6.92 close with a stop at 6.58 risks 0.34 for 0.90 to the leg's end at 7.82: about 2.6 to 1. With the structural stop at 6.24 the risk is 0.68 and the ratio about 1.3 to 1. The tighter stop is hit more often; that is the trade-off.
- Size from the stop, and mind leverage. A fixed share of capital divided by the distance to the stop sets the quantity; keep liquidation well beyond the stop.
Strategy ideas (ideas, not promises)
These are ideas to study, paper-trade and backtest, not recommendations or signals, and not a promise of any result. Every condition below can fail. Crypto trades around the clock and can move sharply at any hour; leverage and options can lose more than you expect, and past behaviour says nothing certain about the next session. Size, entries, exits and risk are your own decisions.
1. In OTE with Bitcoin
- Setup: In OTE in the same direction as BTC's last break, leg of 2.5 ATR or more (LINK on 4 November: bearish, with BTC bearish).
- Entry idea: the next day breaking the In OTE day's low (bearish) or high (bullish).
- Invalidation: a close beyond 79%, or beyond the leg's start for a wider plan.
2. Approaching: a limit plan, not a chase
- Setup: an Approaching row; the close is at 50–62%.
- Idea: note the 62% and 70.5% levels and act only if price gets there.
3. Band on zone
- Setup: an In OTE band that overlaps a zone on the SMC Setups page.
- Reading: two separate readings pointing at the same area.
4. Deep: reduce or pass
- Setup: a Deep row, like INJ at 99.5% of its leg.
- Reading: the leg is close to failing, and the reward to its end has shrunk; any idea here carries the full risk for less.
5. Weekly band, daily trigger
- Setup: a weekly In OTE row (LTC below), then a daily CHoCH in the weekly leg's direction inside the weekly band.
- Reading: the weekly band sets the area, the daily break the timing and a tighter stop.
How to test these
Record past In OTE rows with their 79% level, leg start and leg end, and count how often price reached the leg end before closing beyond the leg start. Compare the 79% stop with the structural one.
Risk per trade - risk a small, fixed share of capital on any one idea. Crypto never closes, so a stop is the only exit while you sleep; with leverage, keep the liquidation price well beyond the stop. When selling options, prefer defined-risk structures (spreads, iron condors) over naked positions.
Test before you trade - write the rules down exactly, test them on past data (see how to backtest an options strategy and the Option Simulator, which supports crypto), then paper-trade at least 20 occurrences before committing real money. Keep a journal of every trade, including the ones you skipped.
Daily or weekly candles
Every Smart Money page has a Candles setting: Daily (the default) or Weekly. Weekly runs the same rules on weekly candles built from the same daily bars.
- A crypto week is Monday to Sunday in IST: the open of Monday 00:00, the week's high and low, the close of Sunday 23:59, with volume added up. Every date in a weekly row is that week's Sunday.
- The current week is the week so far. On a Monday its candle is one day old, so a weekly row seen mid-week can change, or drop off, by Sunday's close.
- Counts become weeks. A swing needs five weeks on each side, ATR 14 is fourteen weeks, and every look-back counts weeks.
- What stays daily. The liquidity gate (the day's turnover and volume), the last price and change.
A weekly idea for OTE: on Weekly the leg, the 30-week limit on the break and the 2-ATR minimum all count weeks, so a weekly OTE is a pullback in a move of months. Applying the page's rules to Binance weekly candles on 6 November 2026, LTCUSDT was In OTE Bullish on weekly candles: a weekly CHoCH in the week to 27 September, a leg from 39.28 (week to 28 June) to 75.00 (week to 27 September), 62% at 52.93, 70.5% at 49.82 and 79% at 46.92, with the week's low reaching 67% of the leg. AVAXUSDT showed the same state. On daily candles both were in downtrends: the weekly band is the area of interest, a daily bullish break inside it would be the timing.
Every tab, filter and column
- Tabs - All, In OTE Bullish, In OTE Bearish, Approaching Bullish, Approaching Bearish, Deep Bullish, Deep Bearish.
- Order - In OTE first, then Deep, then Approaching; within each, the bigger leg (in ATR) first. One row per pair: its newest break.
- Columns - Symbol and LTP; Side; State; Leg Start and Leg End; 62% and 79%; Reached % (how far the day's high or low went back into the leg); Leg (ATR); Break and Broke On; Chart, with the leg, the band and the 70.5% line.
- Controls - Candles (Daily or Weekly), Universe (All, Futures, Options) and the session date.
What the numbers are built from, and what they cannot tell you
The daily candles are rolled up from Unfluke's one-minute spot archive (Binance data) into IST days, 00:00 to 23:59. A "session" on these pages is one such day; crypto has no weekends or holidays, so ten sessions are ten calendar days.
- Which pairs. The live USDT pairs, about 33 on 8 November 2026, with stablecoins left out. The Universe box narrows them to the pairs with a perpetual future (Futures) or with options (Options) in the archive.
- The liquidity gate. A pair is listed only when its 20-day average turnover is above $500,000 and the day's volume is above 0.8 times its 20-day average. There is no circuit rule; crypto has no price bands.
- Weekends. Crypto volume drops on Saturdays and Sundays, and the 0.8× test is made against the average of the 20 days before, most of them weekdays. Applying the gate to Binance candles for 30 pairs: 29 passed on Friday 30 October, 26 on Thursday 5 November, but only 1 on Saturday 7 November and 1 on Sunday 8 November (BTC's volume that Sunday was 0.35 times its average). A row that disappears at the weekend has usually not failed; it is just not shown. Read these pages on a weekday close, or pick one with the session date.
- The newest day can be unfinished. The daily bars are topped up during the day, so the newest day's high, low and volume are partial until 23:59 IST.
- History. The scan pages read about 400 days of daily bars, so a weekly row can rest on at most about 57 weeks. Swings are five days each side (three on Equal Highs & Lows), ATR is 14 days, and zones and swings are followed for 120 days: about four months, not the six months the same 120 sessions span on NSE.
- One exchange, spot only. A wick on one venue may not exist on another, and liquidations happen in perpetual futures, whose volume is often several times spot volume and is not counted here.
- Visitors. Without signing in you see the newest day on daily candles; past dates and the Weekly setting need a free account.
Smart Money Concepts are a way of reading a chart, popularised by the trader known as ICT. There is no official rulebook and no published evidence that they work better than other methods; the pages apply one fixed reading so a row can be checked by hand. They describe what price did, not what it will do.
Where to go next
Open the page at Smart Money → Retracement / OTE (switch the market to Crypto), or sign up free to open the Market Terminal. The NSE version, with the full list of columns, is explained in the Retracement / OTE guide.
The other crypto Smart Money guides: SMC Setups, SMT Divergence, Market Structure, Equal Highs & Lows. The building blocks (fair value gaps, order blocks and liquidity sweeps) are explained in the Fair Value Gaps, Order Blocks and Liquidity Sweeps guides.
More from the blog
- Strategy Backtesting on Unfluke
Backtest trading strategies on real Indian market data with Unfluke. Test equity, Nifty, Bank Nifty and options strategies with realistic costs and key metrics.
- Live Market Scanners
Explore Unfluke's real-time stock scanner for NSE markets. Scan 1,800+ stocks with 40+ technical indicators, fundamental filters, F&O data and custom rules.
- Option Strategy Simulator
Build and simulate multi-leg options strategies with Unfluke. Visualize payoffs, Greeks, max profit and loss, and replay historical option data from 2023.