Crypto
Crypto SMT Divergence: When Bitcoin, Ether, Solana and BNB Disagree
10 min read · Updated 9 Nov 2026
The large coins usually move together: when Bitcoin falls hard, Ether, Solana and BNB rarely escape. So the days they disagree stand out. When Bitcoin makes a new low for the month and Ether does not, Smart Money Concepts call it an SMT divergence (smart money technique) and read the coin that refused the new low as the stronger one.
The crypto SMT Divergence page checks four pairs every day and shows each pair's newest divergence of the last ten days. This guide gives the rule, reads the page's real rows from 6 November 2026, when Bitcoin and Solana made new lows and Ether and BNB did not, and follows what happened next, which is the part most SMT examples leave out.
The rule, and the four crypto pairs
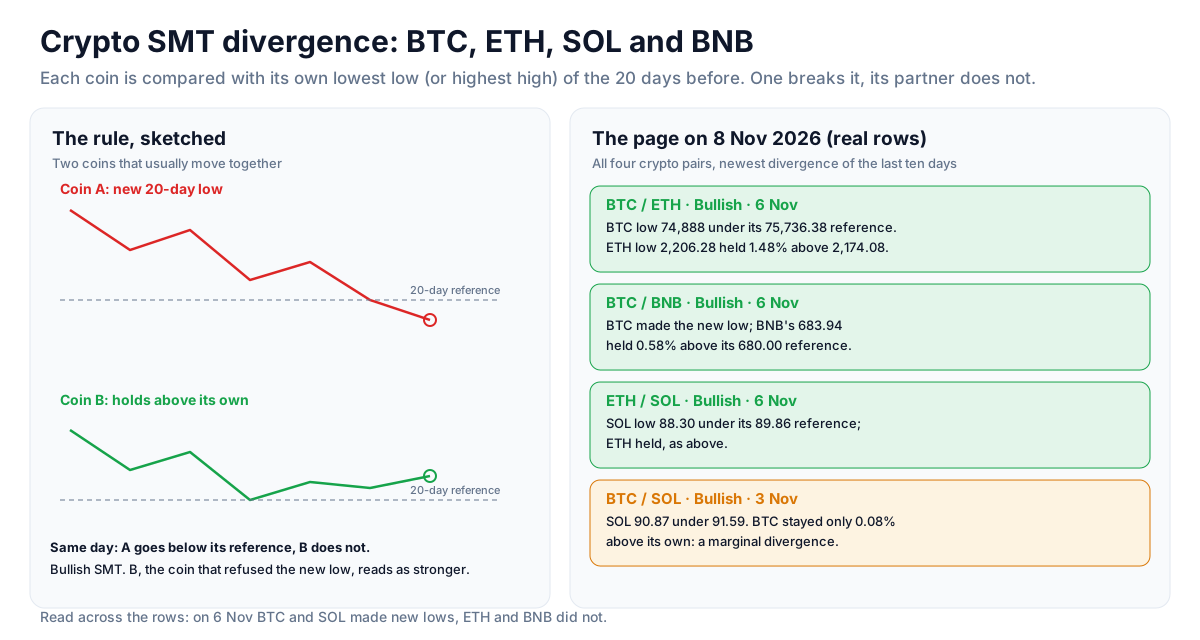
- Bullish SMT - on the same day, one coin's low goes below its lowest low of the previous 20 days and its partner's low stays above its own.
- Bearish SMT - one coin's high goes above its highest high of the previous 20 days and its partner's does not.
- Each coin against its own history. Bitcoin at 75,000 and Solana at 90 never have to be on the same scale; each is only compared with itself.
- Days both have. The two series are lined up on the IST days both traded, so the windows match.
- Newest first. Each pair shows its newest divergence of the last ten days, or none.
The crypto pairs are fixed:
- BTC / ETH - the two largest coins.
- BTC / SOL and ETH / SOL - Solana as the higher-beta large cap.
- BTC / BNB - Binance's own coin, often steadier than the rest.
There is no universe picker on this page; on NSE the same rule runs on index pairs instead (Nifty 50 with Nifty Bank, and so on).
Real rows: the page on 8 November 2026
These are the page's own rows, as a visitor saw them on 8 November. Three pairs showed a bullish divergence on 6 November:
- BTC / ETH, bullish, 6 Nov (2 days ago). BTC's low of 74,888 went under its 20-day reference of 75,736.38. ETH's low that day, 2,206.28, held 1.48% above its own reference of 2,174.08.
- BTC / BNB, bullish, 6 Nov. BTC made the new low; BNB's 683.94 held 0.58% above its reference of 680.00, the round-number low of 30 October.
- ETH / SOL, bullish, 6 Nov. SOL's low of 88.30 went under its 89.86 reference; ETH held, as above.
- BTC / SOL, bullish, 3 Nov (5 days ago). SOL went under its reference (90.87 against 91.59) while BTC stayed above its own by only 0.08%. On 6 November both made new lows, so that day was no divergence for this pair; the 3 November one is its newest.
Read across the rows and one picture appears: on 6 November Bitcoin and Solana made new 20-day lows, and Ether and BNB did not. In SMC terms, Ether and BNB were the stronger side.
What happened next
Through 8 November neither BTC nor ETH went lower: BTC's lows on 7 and 8 November were 75,600.82 and 75,571.08. But in the first hours of 9 November (IST), while this was being written, Ether traded down to 2,060, below its own 2,174.08 reference, and Bitcoin to 73,510. The stronger coin had made its own new low: the idea's invalidation in strategy 1 below. That is the normal fate of many divergences, and the reason to wait for a trigger instead of buying the divergence itself.
A note on the numbers: the page's 20-day reference for BTC was 75,736.38, the low of 4 November. Binance's daily candles show a lower low of 75,568 on 5 November, which the page's minute archive appears to have missed. Both say the same thing here, but a divergence that is decided by a few dollars can come out differently on another data source.
How to use a divergence in a trade
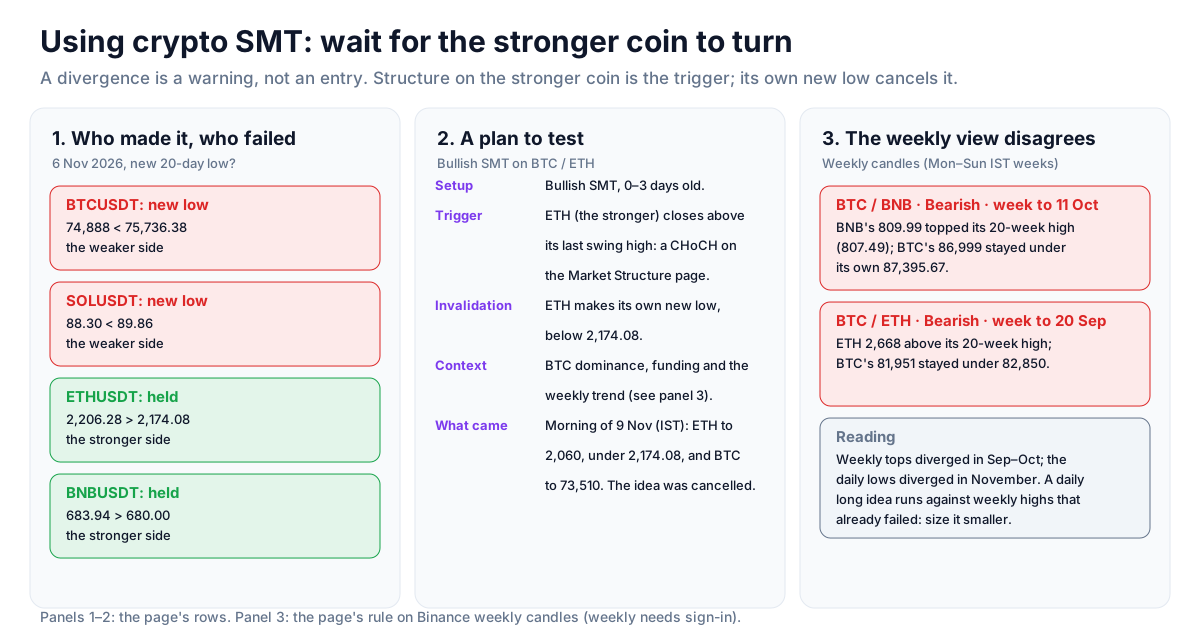
- Find the stronger side. The Failed column names the coin that did not make the new extreme; for a bullish SMT that is the stronger one.
- Wait for a trigger on it. A daily close above the stronger coin's last swing high, which the Market Structure page lists as a bullish CHoCH.
- Set the invalidation in advance. The stronger coin making its own new 20-day low (ETH below 2,174.08 in the example) means the divergence has failed.
- Check how marginal it is. The "short" percentage in the Failed column is how far the stronger coin stayed from its own extreme. BTC's 0.08% on 3 November is a coin's width; ETH's 1.48% on 6 November is a real difference.
- Read several pairs together. Three pairs agreeing on the same day (as on 6 November) tells you more than one.
- Check the weekly view. Divergences at weekly highs and lows carry more weight than daily ones; see the weekly example below.
Strategy ideas (ideas, not promises)
These are ideas to study, paper-trade and backtest, not recommendations or signals, and not a promise of any result. Every condition below can fail. Crypto trades around the clock and can move sharply at any hour; leverage and options can lose more than you expect, and past behaviour says nothing certain about the next session. Size, entries, exits and risk are your own decisions.
1. Bullish SMT, then a break on the stronger coin
- Setup: a bullish SMT no more than three days old with a "short" of 1% or more.
- Trigger idea: a bullish CHoCH on the stronger coin within the next ten days.
- Invalidation: the stronger coin makes its own new 20-day low.
2. Bearish SMT at the highs
- Setup: one coin makes a new 20-day high and its partner fails, after a rally.
- Trigger idea: a close below the weaker coin's last swing low.
- Invalidation: the weaker coin makes the new high after all.
3. Trade the stronger coin, not the pair
- Idea: after a bullish SMT, long ideas in the stronger coin (ETH or BNB on 6 November) rather than in the one that just made the new low.
- Test: compare the next ten days' returns of the stronger and weaker coin after past divergences.
4. Weekly divergences as a filter
- Idea: treat daily bullish divergences that come after weekly bearish ones (as in November 2026) as lower-quality, and size them smaller.
How to test these
Record past divergences from the page with the session date, and what the stronger coin did over the next ten days: did it break its swing high first, or make its own new low first? Compare with days that had no divergence.
Risk per trade - risk a small, fixed share of capital on any one idea. Crypto never closes, so a stop is the only exit while you sleep; with leverage, keep the liquidation price well beyond the stop. When selling options, prefer defined-risk structures (spreads, iron condors) over naked positions.
Test before you trade - write the rules down exactly, test them on past data (see how to backtest an options strategy and the Option Simulator, which supports crypto), then paper-trade at least 20 occurrences before committing real money. Keep a journal of every trade, including the ones you skipped.
Daily or weekly candles
Every Smart Money page has a Candles setting: Daily (the default) or Weekly. Weekly runs the same rules on weekly candles built from the same daily bars.
- A crypto week is Monday to Sunday in IST: the open of Monday 00:00, the week's high and low, the close of Sunday 23:59, with volume added up. Every date in a weekly row is that week's Sunday.
- The current week is the week so far. On a Monday its candle is one day old, so a weekly row seen mid-week can change, or drop off, by Sunday's close.
- Counts become weeks. A swing needs five weeks on each side, ATR 14 is fourteen weeks, and every look-back counts weeks.
- What stays daily. The liquidity gate (the day's turnover and volume), the last price and change.
A weekly idea for SMT: on Weekly the new high or low is measured against the previous 20 weeks and a divergence stays listed for ten weeks. Applying the page's rule to Binance weekly candles on 8 November 2026, all four pairs showed a bearish weekly divergence at the autumn highs: in the week to 11 October BNB's high (809.99) went above its 20-week high while BTC's 86,999.11 stayed under its own 87,395.67, and in the week to 20 September ETH made a new 20-week high that BTC did not. So the daily bullish divergences of November came after failed weekly highs: context for keeping a long idea small.
Every tab and column
- Tabs - All Pairs (every pair, with its newest divergence of the last ten days or None), Bullish, Bearish, and Today (divergences on the day shown).
- Pair, First, Second - each coin's close and change on the day shown.
- SMT - Bullish, Bearish or None, with the Date and Ago (days before the one shown).
- Made It - the coin that made the new 20-day extreme.
- Failed - the coin that did not, and how far short of its own reference it stayed.
- Chart - one button per coin: its candles with its 20-day reference line and the divergence day marked.
- Controls - Candles (Daily or Weekly) and the session date. The four pairs are always shown; there is no universe or liquidity filter on this page.
What the numbers are built from, and what they cannot tell you
The page reads about two months of daily bars (about 11 months on Weekly) for the four coins from Unfluke's spot archive (Binance data), rolled up into IST days, 00:00 to 23:59.
- A day is an IST day. A low made at 02:00 IST belongs to that IST day, which is the evening before in New York. A divergence can look different on a chart that uses UTC days.
- The newest day can be unfinished. A divergence on the newest day can still be undone before 23:59 IST if the partner coin makes its own new extreme.
- One exchange, spot only. A wick on Binance spot may not appear on other exchanges or on the perpetuals, and the reverse.
- Visitors. Without signing in you see the newest day on daily candles; past dates and the Weekly setting need a free account.
Smart Money Concepts are a way of reading a chart, popularised by the trader known as ICT. There is no official rulebook and no published evidence that they work better than other methods; the pages apply one fixed reading so a row can be checked by hand. They describe what price did, not what it will do.
Where to go next
Open the page at Smart Money → SMT Divergence (switch the market to Crypto), or sign up free to open the Market Terminal. The NSE version, with the full list of columns, is explained in the SMT Divergence guide.
The other crypto Smart Money guides: SMC Setups, Market Structure, Retracement / OTE, Equal Highs & Lows. The building blocks (fair value gaps, order blocks and liquidity sweeps) are explained in the Fair Value Gaps, Order Blocks and Liquidity Sweeps guides.
For positioning and funding on BTC and ETH, read the Binance Futures guide.
More from the blog
- Strategy Backtesting on Unfluke
Backtest trading strategies on real Indian market data with Unfluke. Test equity, Nifty, Bank Nifty and options strategies with realistic costs and key metrics.
- Live Market Scanners
Explore Unfluke's real-time stock scanner for NSE markets. Scan 1,800+ stocks with 40+ technical indicators, fundamental filters, F&O data and custom rules.
- Option Strategy Simulator
Build and simulate multi-leg options strategies with Unfluke. Visualize payoffs, Greeks, max profit and loss, and replay historical option data from 2023.