Market Terminal
Volume Shockers: Stocks Trading Many Times Their Usual Volume, and How to Read Them
11 min read · Updated 9 Nov 2026
Most days a stock trades roughly the number of shares it usually trades. Then one day it trades ten or twenty times that. Something made a lot of people act at once: results, news, a large order, a breakout everyone was watching. A volume shock does not tell you what happened or whether the move will last, but it is one of the plainest signs that a stock deserves a closer look today.
The Volume Shockers page lists every liquid NSE company whose volume was at least two times its usual, end of day, with the price move, the delivery % and the distance from the 52-week high beside it. This guide explains the measure, reads real rows from 6 November 2026 (SAILIFE, ICICIBANK, THERMAX and MMFL), and shows how traders turn a row into a plan.
What a volume shock is, and how the page measures it
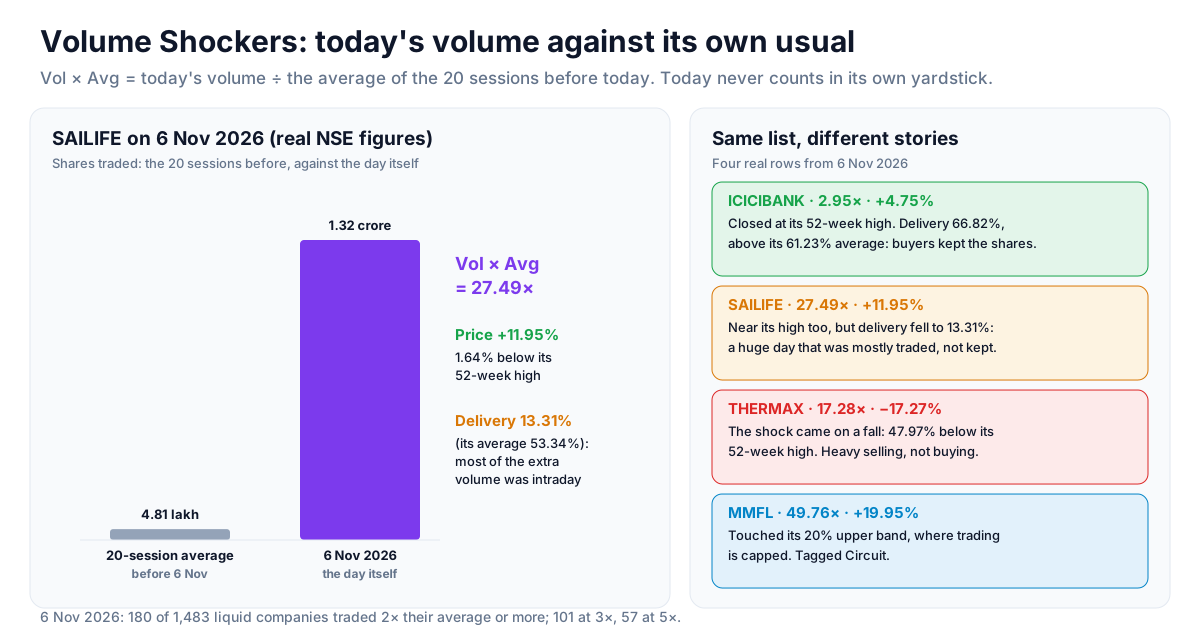
The multiple: Vol × Avg
The page divides the day's volume by the average volume of the 20 sessions before it:
Vol × Avg = today's volume ÷ average volume of the previous 20 sessions
The day itself is left out of its own average on purpose. If it were included, a day of 30 times normal volume would lift the average it is measured against and read as about 6×. Leaving it out keeps the number honest: 27.49× means the day traded 27.49 times what a normal day of the last month traded.
A ratio is used instead of raw volume because stocks differ enormously in size. Ten lakh shares is a quiet morning for a large bank and a year's worth for a small company. Measured against its own average, every stock is on the same scale.
Why the price, delivery and 52-week high sit beside it
Volume says that many people acted. It does not say which way or how firmly. The page puts three answers next to each row:
- The day's change: a shock on a rising day and a shock on a falling day are different stories, so the page splits them into the Price Up and Price Down tabs.
- Delivery % (NSE only): the share of the day's traded quantity that was delivered rather than squared off the same day, against its own 20-session average. A shock with delivery above its average means buyers and sellers kept the shares. A shock with delivery far below it was mostly intraday trading (the Delivery % guide explains the measure).
- From 52W High: how far the close is from the highest price of the last 252 sessions, today included. Heavy volume at a new high is a breakout; heavy volume 40% below the high is something else.
Which stocks are scanned
- Companies only. ETFs and index funds are left out: their volume jumps when units are created or redeemed, which says nothing about a stock.
- A 20-session average turnover above ₹1 crore. Below that, one large order is a "shock". The gate is lower than the momentum scanners' ₹5 crore on purpose, because a shock in a mid or small company is the point of the page. The average covers the last 20 sessions with the day itself included, so a quiet stock can clear the gate on the strength of its shock.
- Circuit hitters are kept and tagged Circuit, not dropped.
- Stocks that traded under ₹10 lakh on the day, or that barely move at all (an average daily range under 0.25%), are left out of every momentum-pass scan.
Reading real rows: 6 November 2026
On 6 November 2026 the page scanned 1,483 liquid companies. 180 traded at least 2× their average, 101 at least 3× and 57 at least 5×. They were split almost evenly: 86 closed up and 93 down. Only 49 of the 180 had delivery above their own average, which is typical: most volume shocks are driven by traders, not by people buying to hold.
SAILIFE: a huge shock that was mostly traded
- Vol × Avg 27.49×: 1.32 crore shares against a 20-session average of 4.81 lakh.
- Price +11.95% to 1,785.10, closing 1.64% below its 52-week high of 1,814.90 (the day's own high). Tags: Price up, Near 52W high.
- Delivery 13.31% against an average of 53.34%. Most of the extra volume was bought and sold within the day.
The price action is strong: a move of nearly 12% to the year's high. But the low delivery says the crowd that made the day was mostly trading it. That does not make the move wrong; it means the next few sessions, when the day traders have gone, will say more than the shock day did.
ICICIBANK: a small multiple with a better shape
- Vol × Avg 2.95×, +4.75%, closing exactly at its 52-week high (From 52W High 0%).
- Delivery 66.82% against an average of 61.23%: more of the shares were kept than usual.
For a stock as heavily traded as ICICIBANK, three times normal volume is a lot of money. Combined with a close at the year's high and above-average delivery, this is the cleaner of the two breakouts, even though its multiple is a tenth of SAILIFE's. The biggest number on the page is not automatically the best row.
THERMAX: the shock on a fall
THERMAX traded 17.28× its average and closed −17.27% at 2,746.30, 47.97% below its 52-week high, with delivery at 41.3% against 53.28%. It also opened with a gap of −9.33% and never got back near the previous close (see the Gap Scanner guide). Heavy volume on a sharp fall is selling with conviction. Before reading anything into it, check the Result Calendar and filings for the reason.
MMFL: a circuit day
MMFL traded 49.76× its average and rose +19.95%, touching its 20% upper price band (tags: Price up, Circuit). At the band, trading is capped: there can be buyers left with no sellers, so neither the price nor the volume shows the full demand. The move may continue the next morning or reverse; the shock day says little about which. See the price band guide for how bands work.
JSWCEMENT: lots of shares, no move
JSWCEMENT traded 25.70× its average but moved only +0.73%, with delivery near its usual (47.6% against 50.26%). A huge volume with a flat price often means a large negotiated trade crossed in the market. The Large Deals page shows whether a bulk or block deal was reported that day.
How to use it in a trade
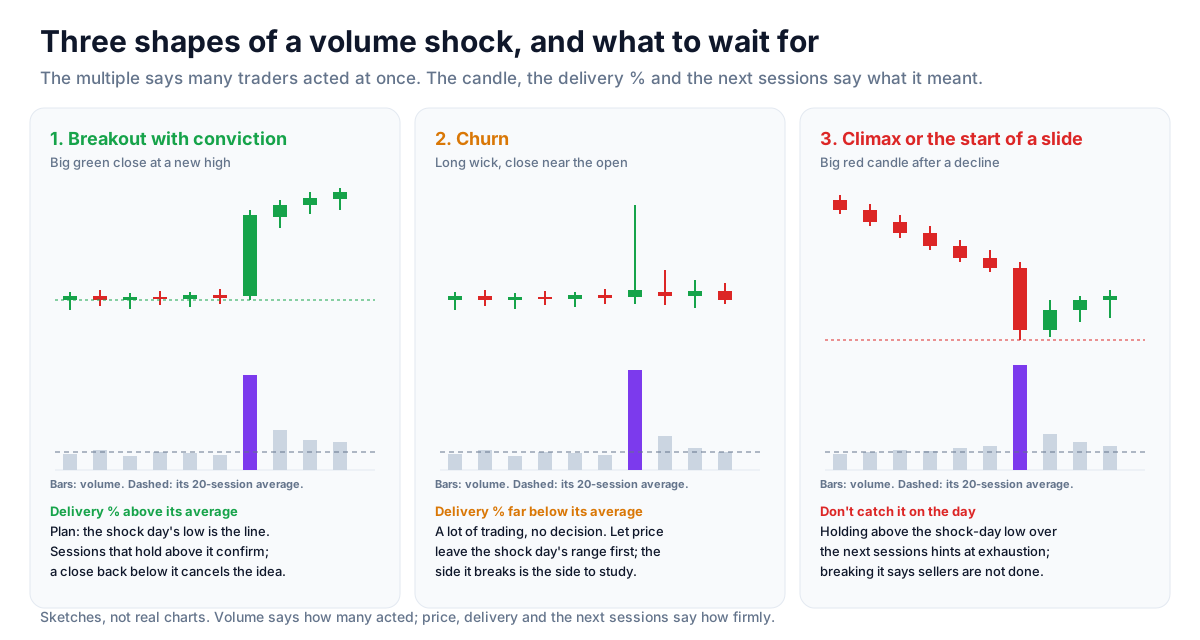
A step-by-step way to go from a row to a plan:
- Pick the side first. Use the Price Up or Price Down tab, not All. A long idea should start from rows that rose; mixing the two hides what you are looking at.
- Start with the Near 52W High tab for breakouts. Heavy volume at the year's high (17 rows on 6 November) is the classic breakout picture. Heavy volume far below the high is more often a bounce inside a downtrend.
- Read delivery against its average. Above its usual (ICICIBANK) means shares were taken home. Far below (SAILIFE) means the day was traded. Neither is a verdict, but a breakout with conviction usually has the first.
- Open the chart. The Chart button shows the daily candles with the shock day marked and the 52-week high drawn across. A close near the day's high is stronger than a long upper wick back to the open.
- Find the reason. Results, an order win, a block deal, an index inclusion, a regulator's action. The Results Reaction page, Large Deals and the filings will usually show it. A shock with no visible reason deserves more caution, not less.
- Use the shock day's range. The page is end of day, so any trade is for the next sessions. For a breakout, the shock day's low is a natural line: sessions that hold above it confirm the move, a close below it says the buyers did not stay. For a fall, the mirror: a bounce that cannot reclaim the shock day's high says sellers are still in charge.
A volume shock is also a warning for anyone already holding the stock. If something you own appears on the Price Down tab at 10× its average, find out why before the next open.
Strategy ideas (ideas, not promises)
These are ideas to study, paper-trade and backtest, not recommendations or signals, and not a promise of any result. A volume shock can be a one-day event, and a breakout on heavy volume can fail the next morning. Size, entries, exits and risk are your own decisions.
1. High-volume breakout with delivery
- Setup: Near 52W High tab, Vol × Avg 3× or more, the day up, and delivery % above its own average. ICICIBANK on 6 November had this shape at 2.95×.
- Entry idea: on the next session, only if it holds above the shock day's close in the first hour, or on a later pullback that holds above the shock day's low.
- Invalidation: a daily close below the shock day's low.
- Test: compare breakouts with delivery above average against those with delivery below it. If the difference is not there in your sample, drop the condition.
2. Wait out the churn
- Setup: a shock with delivery far below its average, or a long upper wick with the close near the open.
- Idea: do nothing on the day. Mark the shock day's high and low and wait for a daily close outside that range. The side it breaks is the side the bigger money took.
- Invalidation: a break that falls back inside the range within two sessions.
3. Selling climax watch
- Setup: Price Down tab, Vol × Avg 5× or more, after a decline (well below the 52-week high), with a known reason that the market has now priced.
- Idea: watch for several sessions that hold above the shock day's low on falling volume. That is the first sign the selling exhausted itself. Never on the shock day itself.
- Invalidation: a close below the shock day's low.
4. A watchlist, not a trade
- Setup: any row at 5× or more in the F&O universe.
- Idea: add it to a watch list for a week and check the OI buildup in its futures. A shock with rising open interest is new positions; with falling open interest it is positions being closed.
How to test these
Signed-in users can step back through past sessions with the date box. Note every row that met an idea's setup and record what the stock did over the next 5 and 20 sessions, including the ones that failed. Backtest the entry and exit rules on Unfluke before trading real money.
Every tab, filter and column
The tabs
- All Shockers: every stock at or over the chosen multiple, biggest multiple first.
- Price Up: the shock came on a day the stock closed higher.
- Price Down: the shock came on a day it closed lower.
- Near 52W High: closed within 5% of its 52-week high. A stock needs a full year of history (252 sessions) for this tag.
The filters
- Volume at least: 2× (the default), 3× or 5× the 20-session average.
- Session date: the newest session by default; signed-in users can pick an earlier one.
- Universe: All, Nifty 50, Nifty Next 50, Nifty Bank, F&O or Nifty 500.
- Export CSV: the rows on screen as a spreadsheet.
The columns
- Symbol, LTP: the stock, its close and the day's change.
- Sector: the broad sector.
- Vol × Avg: the day's volume ÷ the average of the 20 sessions before it; highlighted at 5× or more.
- Volume: shares traded on the day.
- 20D Avg Vol: the average of the 20 sessions before the day.
- Delivery %: the day's delivery share (NSE).
- From 52W High: the close against the 52-week high; 0% is at the high.
- Avg Turnover: the average traded value of the last 20 sessions.
- Signal: Price up, Price down, Near 52W high, Circuit (the day touched its price band).
- 5 Days: the last five daily candles, newest on the right.
- Chart: the daily candles with the shock day marked and the 52-week high line, plus the volume, its average, the multiple, the delivery % and its average.
What the numbers are built from
Everything is end of day, from NSE's daily Bhavcopy, with prices and volumes adjusted for splits and bonuses so a 1:10 split does not read as a tenfold volume shock. The average volume is a plain mean of the 20 sessions before the scanned one. Delivery % and delivered quantity come from the same Bhavcopy; its average is also over the 20 sessions before. The 52-week high is the highest daily high of the last 252 sessions, the scanned one included. Sectors come from Unfluke's company profiles, which is also how ETFs and funds are told apart from companies. Because the liquidity gate is applied each day, a stock can be on the page one day and absent the next.
Where to go next
For opening gaps on the same day, read the Gap Scanner guide; for the quality of the buying, the Delivery % guide; for the intraday volume leaders, the Volume Gainers guide; and for breakouts to new highs, the 52 Week High guide. Open the page at Watch List → Volume Shockers, or sign up free to run it on past dates.
More from the blog
- Strategy Backtesting on Unfluke
Backtest trading strategies on real Indian market data with Unfluke. Test equity, Nifty, Bank Nifty and options strategies with realistic costs and key metrics.
- Live Market Scanners
Explore Unfluke's real-time stock scanner for NSE markets. Scan 1,800+ stocks with 40+ technical indicators, fundamental filters, F&O data and custom rules.
- Option Strategy Simulator
Build and simulate multi-leg options strategies with Unfluke. Visualize payoffs, Greeks, max profit and loss, and replay historical option data from 2023.