Market Terminal
Demat Account Growth in India: How to Read Depository Stats
8 min read · Updated 2 Nov 2026
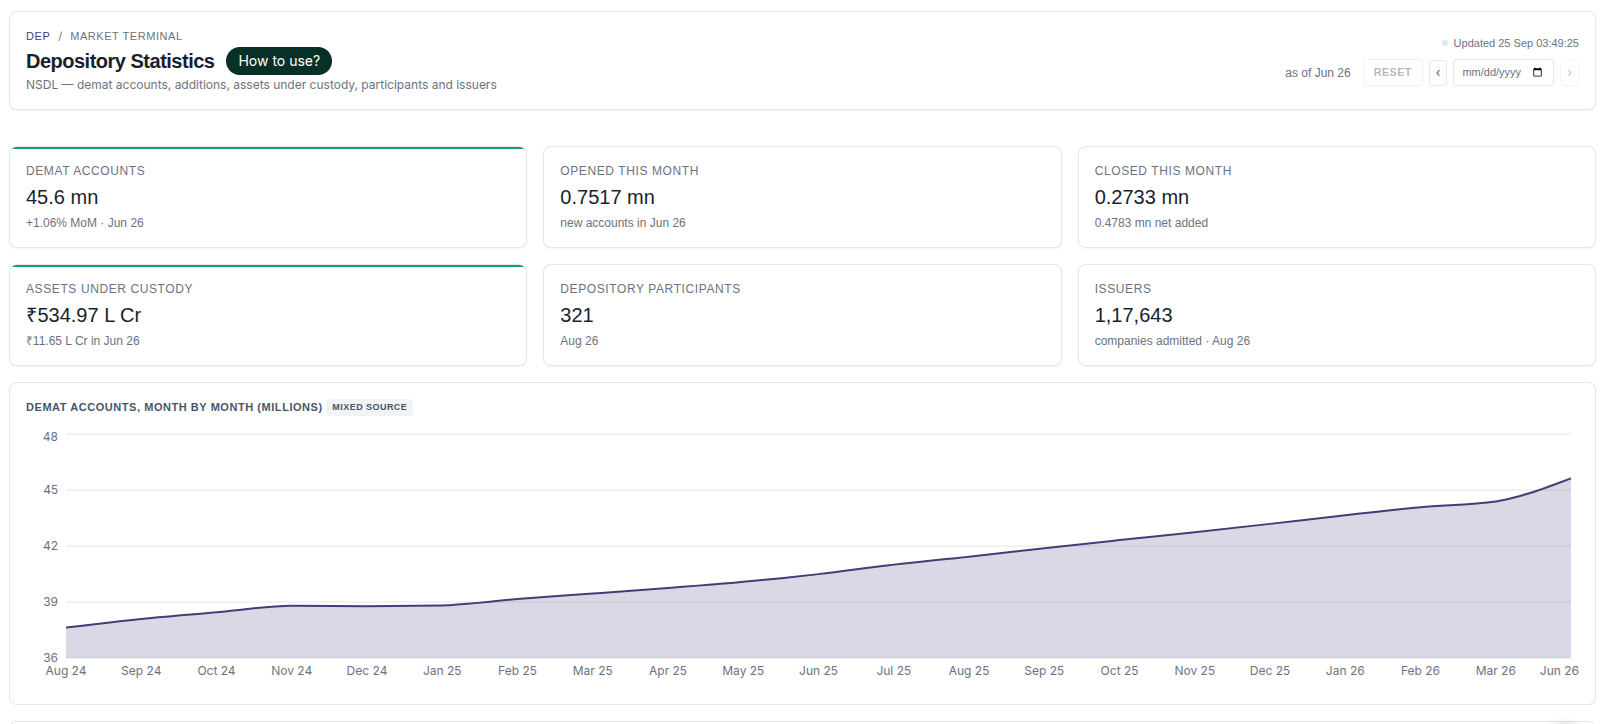
Depository Stats shows NSDL's monthly figures: total demat accounts, accounts opened and closed, assets under custody, depository participants and issuers.
This guide explains each figure and how demat account growth is used as a view of retail participation in Indian markets.
What are depository statistics?
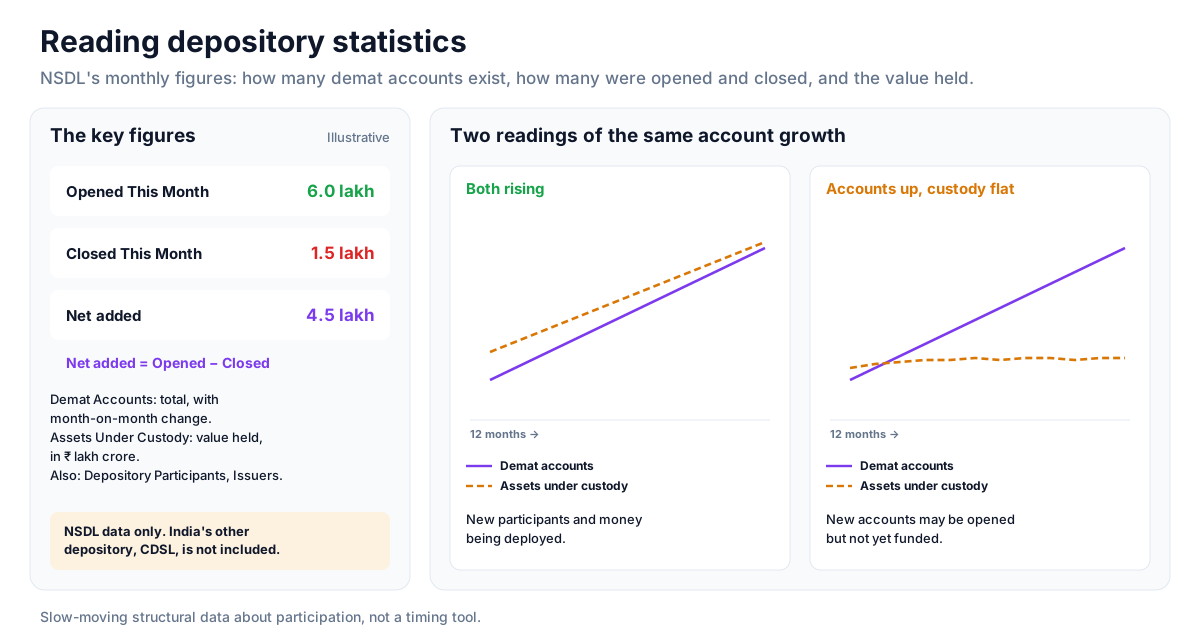
A depository holds investors' shares in electronic form, in demat accounts. India has two depositories, NSDL and CDSL; this page shows NSDL data only. Because opening a demat account is a deliberate step, growth in accounts is widely followed as a sign of how many people are joining the equity market.
How to read it
- Demat Accounts - total accounts, with month-on-month change.
- Opened This Month / Closed This Month - new accounts and closures, with the net number added.
- Assets Under Custody - value of securities held, in ₹ lakh crore, with the monthly change.
- Depository Participants - brokers and other intermediaries offering NSDL accounts; Issuers - companies whose securities are admitted.
- Demat accounts chart - account base month by month, in millions.
- Assets under custody chart - custody value over time.
- Accounts by participant category - accounts and share by category for the latest month.
- Monthly account base table - month, accounts, opened, closed, net added and MoM change.
Using the page for research
- Look at the trend in net accounts added rather than a single month.
- Compare account growth with growth in assets under custody.
- Note months where closures rise noticeably.
- Read the data alongside market conditions over the same period.
Reading demat account growth
Faster account openings usually follow periods of strong market returns that draw in new participants; a slowdown usually follows weaker periods. Historically, surges in new retail participation late in long rallies have often been discussed as a sign of exuberance, which is why the figure is sometimes read alongside valuation data.
Rising accounts together with rising assets under custody reflects both new participants and money being deployed. Accounts rising while custody growth stalls can mean new accounts are opened but not yet funded. This is slow-moving structural data, not a timing tool.
Strategy ideas (ideas, not promises)
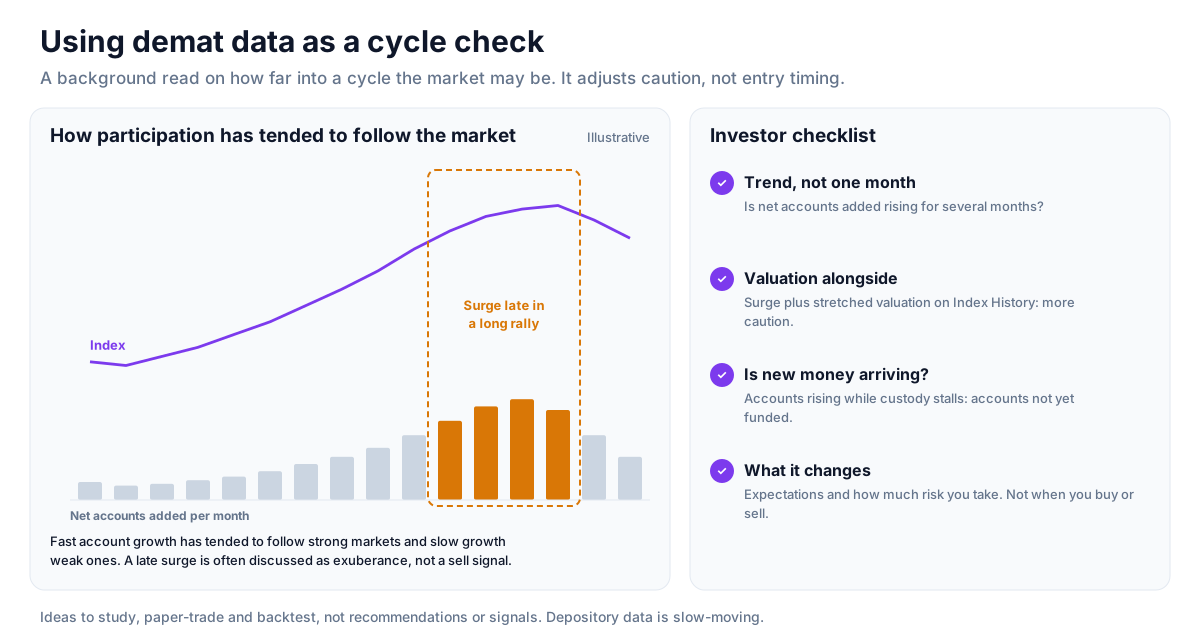
These are ideas to study, paper-trade and backtest, not recommendations or signals, and not a promise of any result. Depository data is slow-moving and describes participation, not timing. Size, entries, exits and risk are your own decisions.
1. Read retail participation as a cycle
- Setup: the net accounts added trend on Depository Stats over many months.
- Reading: fast growth has tended to follow strong markets and slow growth weak ones.
- Use: a background read on how far into a cycle the market may be.
2. Pair account growth with valuation
- Setup: a surge in new accounts while Index History shows stretched valuation.
- Reading: a combination often discussed as exuberance late in a rally; a reason for more caution rather than a sell signal.
3. Check whether new money is arriving
- Setup: compare account growth with assets under custody.
- Reading: accounts rising while custody stalls can mean new accounts are not yet funded.
How to test these
Line up past months of net accounts added with the index's returns on the Returns Heatmap over the following year, and see how often a surge in accounts came near the end of a strong period.
Where to go next
Return to the reference data guide or read the Nifty PE ratio guide for valuation context. Try Depository Stats free.
How to Read This Data
Depository statistics from NSDL and CDSL show the number of demat accounts and related activity over time. Analysts use them to study how retail participation in Indian markets has grown or slowed.
- Look at the trend over several months rather than one update.
- Compare growth at the two depositories.
- Compare account growth with broader market conditions over the same period.
- Note that the number of accounts and the number of active investors are different things.
Limitations: Account counts are aggregate figures published with a delay. They describe participation, not market direction.
More from the blog
- Strategy Backtesting on Unfluke
Backtest trading strategies on real Indian market data with Unfluke. Test equity, Nifty, Bank Nifty and options strategies with realistic costs and key metrics.
- Live Market Scanners
Explore Unfluke's real-time stock scanner for NSE markets. Scan 1,800+ stocks with 40+ technical indicators, fundamental filters, F&O data and custom rules.
- Option Strategy Simulator
Build and simulate multi-leg options strategies with Unfluke. Visualize payoffs, Greeks, max profit and loss, and replay historical option data from 2023.