Market Terminal
Nifty PE Ratio, PB Ratio and Dividend Yield: How to Read Index Valuation
10 min read · Updated 2 Nov 2026
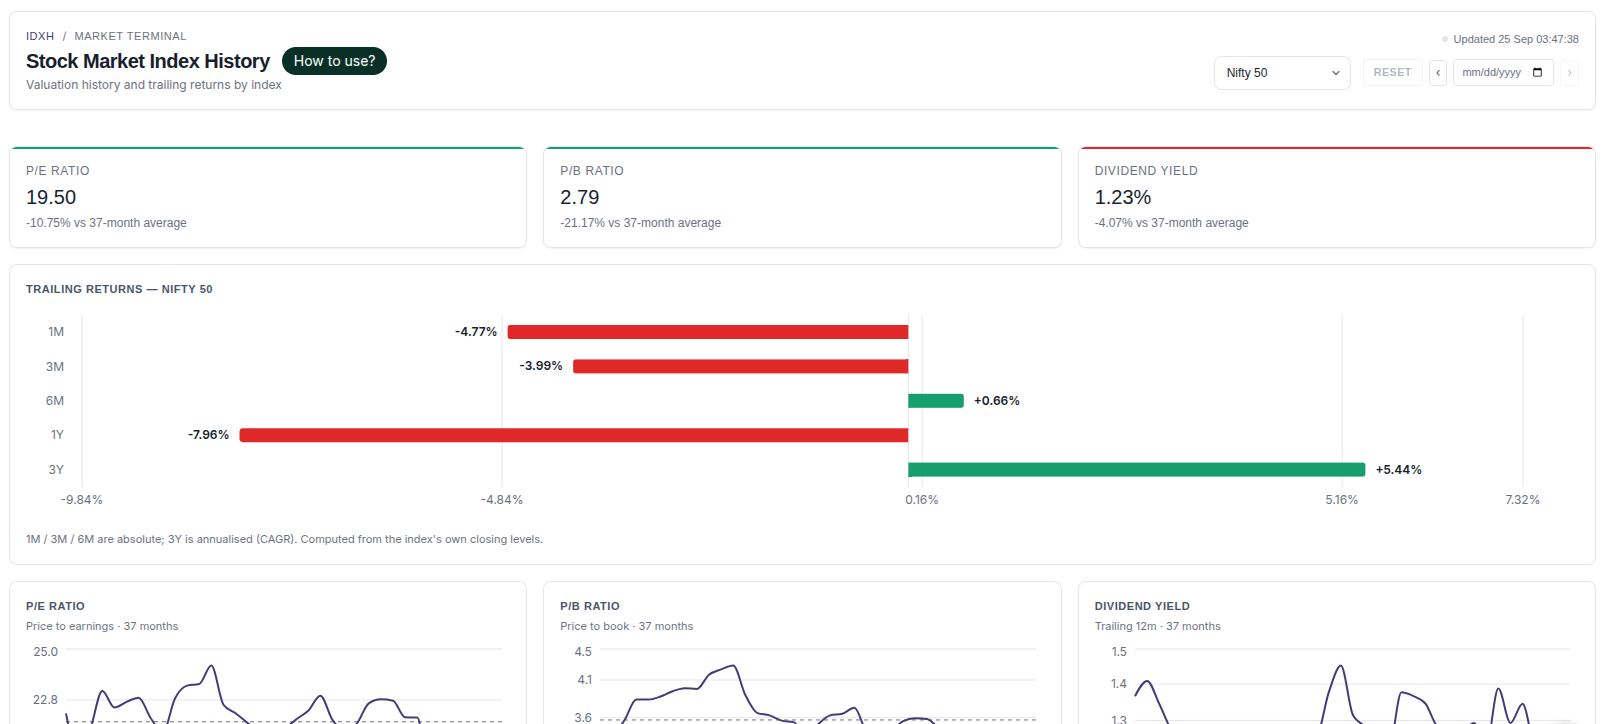
Index History shows the P/E ratio, P/B ratio and dividend yield of seven NSE indices over roughly three years, each compared with its own average, alongside the index's trailing returns.
This guide explains the three valuation measures, how to read each part of the page, and how valuation is commonly used as background context.
What is the Nifty PE ratio?
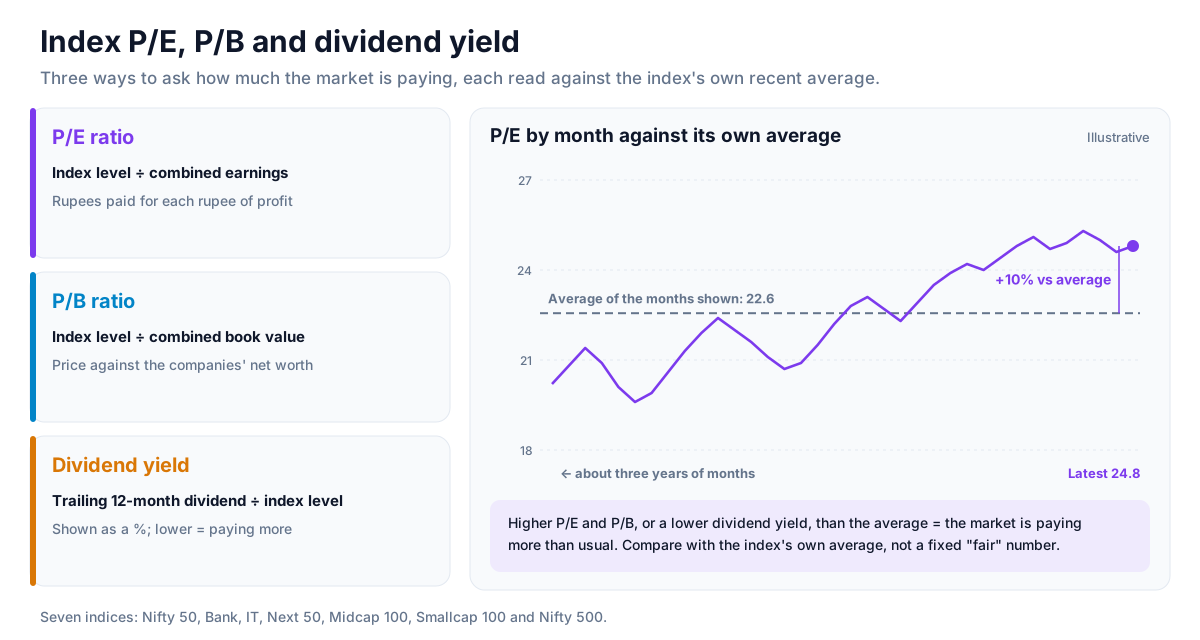
The P/E ratio (price to earnings) of an index is its level divided by the combined earnings of its member companies - roughly, how many rupees the market pays for each rupee of profit. The P/B ratio (price to book) compares the index with the book value of its companies. The dividend yield is the trailing 12-month dividend as a percentage of the index level.
Higher P/E and P/B, and a lower dividend yield, mean the market is paying more for the same earnings, book value or dividends. The page covers Nifty 50, Nifty Bank, Nifty IT, Nifty Next 50, Nifty Midcap 100, Nifty Smallcap 100 and Nifty 500.
How to read it
- Index selector - choose one of the seven indices; a date picker sets the "as of" day.
- Valuation cards - the latest P/E, P/B and dividend yield, each with how far it sits above or below its average over the months shown.
- Trailing returns - a bar chart of 1M, 3M and 6M returns (absolute) and 3Y return (annualised, CAGR), calculated from the index's own closing levels.
- Valuation charts - one chart each for P/E, P/B and dividend yield by month, with a reference line at the average.
- Monthly valuation table - the last 12 months of values in one place.
Using the page for research
- Start with the cards: is each measure above or below its own average, and by how much?
- Check whether P/E and P/B point the same way. P/E can be distorted by a temporary swing in earnings; P/B moves more slowly.
- Use the charts to see whether the current level is a spike or part of a longer trend.
- Switch indices to compare, for example, Nifty 50 with Nifty Smallcap 100.
Valuation as background context
Comparing with the index's own average is more useful than a fixed "fair" number, because normal valuation levels shift with interest rates, growth expectations and market regime.
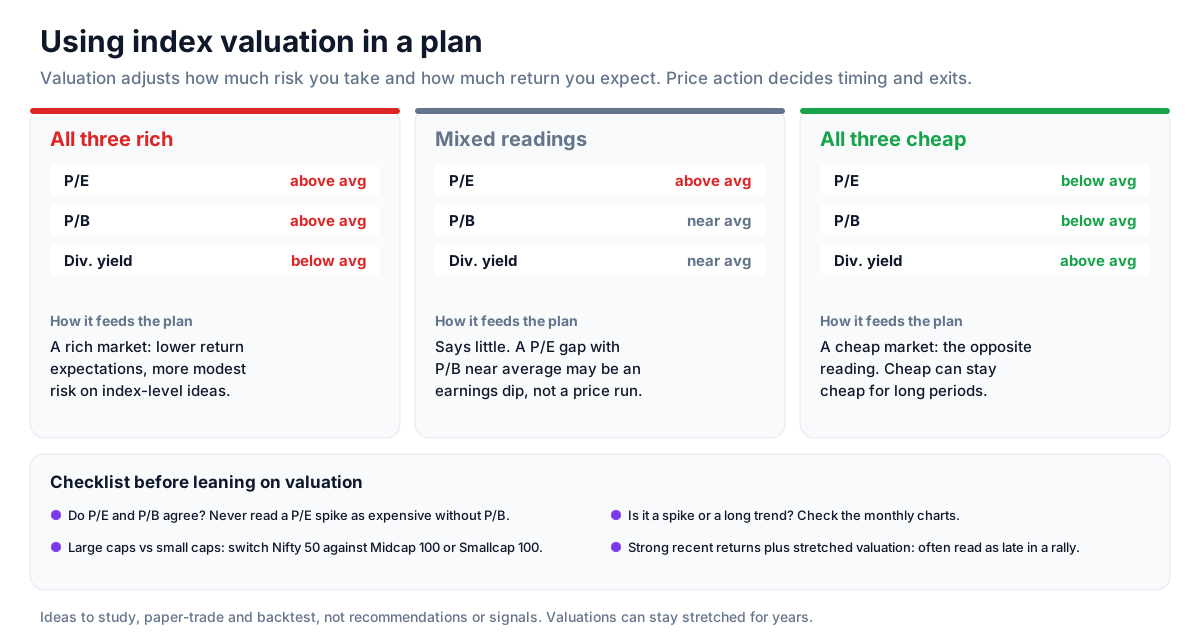
When P/E, P/B and dividend yield all show the market as expensive relative to its average, that is a stronger reading than any one measure alone - and the same applies in reverse. Valuations can stay stretched or depressed for long periods, so these readings are generally treated as background for risk assessment rather than as a timing signal.
Strategy ideas (ideas, not promises)
These are ideas to study, paper-trade and backtest, not recommendations or signals, and not a promise of any result. Valuations can stay stretched or depressed for years. Size, entries, exits and risk are your own decisions.
1. Use valuation to set expectations, not entries
- Setup: the three cards on Index History: P/E, P/B and dividend yield against their own averages.
- Reading: all three far above average describes a rich market; all three below describes a cheap one. Mixed readings say little.
- Use: let it adjust how much risk you take and how much return you expect, while price action decides timing.
2. Check that P/E and P/B agree
- Setup: a P/E far from its average.
- Reading: if P/B is near its average, the P/E gap may come from a swing in earnings rather than from prices.
- Invalidation: do not read a P/E spike as expensiveness without checking P/B.
3. Compare large caps with small caps
- Setup: switch between Nifty 50 and Nifty Smallcap 100 or Nifty Midcap 100.
- Reading: if one segment is near its average while another is far above, the risk sits in different parts of the market.
4. Pair valuation with trailing returns
- Setup: the trailing returns chart (1M, 3M, 6M, 3Y CAGR) on the same page.
- Reading: strong recent returns together with stretched valuation is a combination often discussed as late in a rally; weak returns with cheap valuation as the opposite.
How to test these
Pick past dates with the date picker, note where each measure stood against its average, then check the index's return over the following year on the Returns Heatmap. Look for how often extremes were followed by weaker or stronger years, and how long they lasted.
Where to go next
Read comparing sector index valuations next, or return to the reference data guide. Try Index History free.
How to Read This Data
Index history shows long-term index levels together with valuation measures such as P/E, P/B and dividend yield. It helps put the current level in historical context, for example comparing today's P/E with the index's own long-term range.
- Compare the current P/E or P/B with the index's own historical range.
- Look at past drawdowns and how long recoveries took.
- Compare trailing returns over different periods (1, 3, 5 years) to see how results depend on the start date.
- Compare broad and sector indices, keeping in mind that their typical valuations differ.
Limitations: Historical valuations and returns do not predict future returns. Index methodology and composition change over time, which affects long-term comparisons.
More from the blog
- Strategy Backtesting on Unfluke
Backtest trading strategies on real Indian market data with Unfluke. Test equity, Nifty, Bank Nifty and options strategies with realistic costs and key metrics.
- Live Market Scanners
Explore Unfluke's real-time stock scanner for NSE markets. Scan 1,800+ stocks with 40+ technical indicators, fundamental filters, F&O data and custom rules.
- Option Strategy Simulator
Build and simulate multi-leg options strategies with Unfluke. Visualize payoffs, Greeks, max profit and loss, and replay historical option data from 2023.