Market Terminal
Earnings Momentum: Which Companies' Profit Growth Is Speeding Up, and Which Is Slowing
12 min read · Updated 9 Nov 2026
Share prices follow profits over time, but the market rarely pays for growth that has already happened. What moves prices is a change in the rate: a company whose profit growth climbs from 18% to 30% to 32% is being re-rated, while one whose growth drifts from 12% to 8% to 7% is being quietly marked down, even though both are still growing. That change in pace is what traders mean by earnings momentum.
The Earnings Momentum page lines up every listed company's latest quarterly results against the same quarter a year earlier, works out whether profit growth is speeding up or slowing down, counts how many quarters in a row it has grown, and shows how the share price has moved since the results came out. This guide explains each rule and reads real rows from the Q2 FY27 season as it stood on 6 November 2026: TECHM, TCS, CENTRALBK, DMART and BPCL.
What earnings momentum is, and the exact rules
Year on year, not quarter on quarter
Many businesses are seasonal: a retailer's December quarter is not comparable with its June quarter. So every growth figure on the page compares a quarter with the same quarter a year earlier. Q2 FY27 (July to September 2026) is compared with Q2 FY26.
- Sales YoY: net sales against the year-ago quarter.
- Profit YoY: adjusted profit after tax against the year-ago quarter. "Adjusted" leaves out exceptional items, so a one-off gain from selling a building does not read as growth. Where a company reports no adjusted figure, reported profit is used.
- EBITDA margin: EBITDA (PBIDT) ÷ net sales for the quarter, and its change against a year earlier in percentage points.
Acceleration
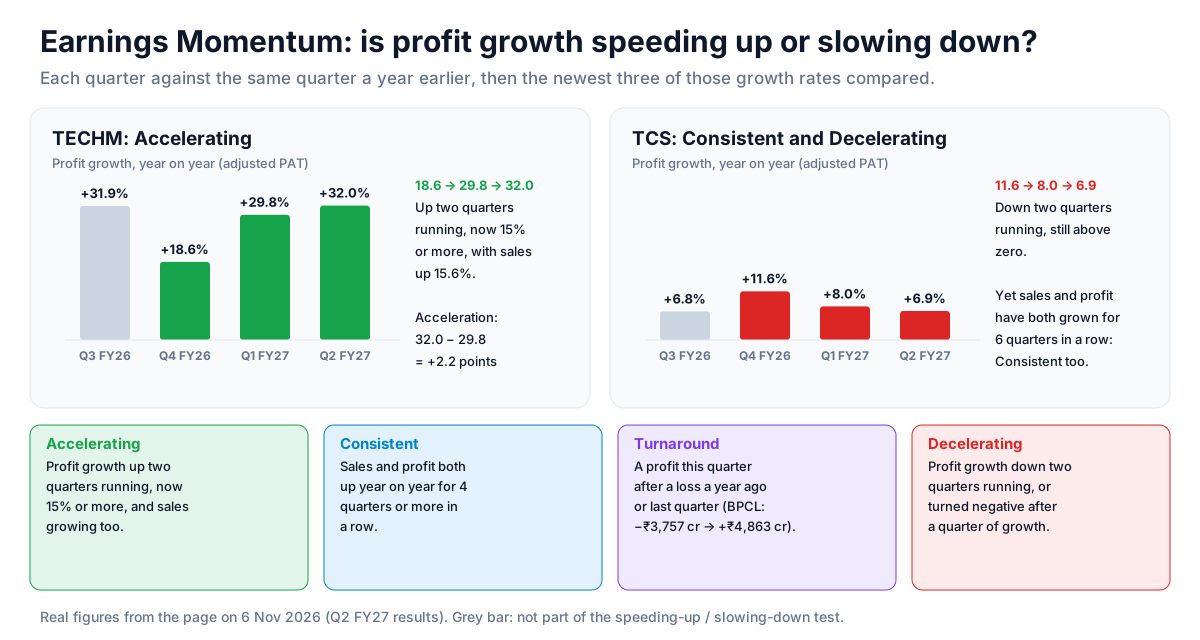
The page works out profit growth for the newest quarter and the three before it. Acceleration is the newest quarter's profit growth minus the previous quarter's, in percentage points. TECHM grew profit 32.0% in Q2 FY27 after 29.8% in Q1 FY27, so its acceleration is +2.2 points.
The four tags
- Accelerating: profit growth up two quarters running (newest > previous > the one before), the newest at 15% or more, and sales growing too.
- Consistent: sales and profit both up year on year, with a profit, for four quarters or more in a row. The Growth Streak column counts the run, up to nine quarters.
- Turnaround: a profit this quarter after a loss a year ago or in the previous quarter.
- Decelerating: profit growth down two quarters running while still positive two quarters ago, or growth turned negative after a quarter of growth.
A company can carry two tags at once: TCS is both Consistent and Decelerating.
When growth is left blank
Growth on a tiny base is meaningless: a profit of ₹6 crore against ₹1 lakh a year ago reads as +59,900%. So the page leaves profit growth blank ("small base") when the year-ago profit was under ₹1 crore or under 1% of that quarter's sales, and blank when the year-ago figure was a loss. Companies with quarterly sales under ₹10 crore are left out altogether.
The price since results
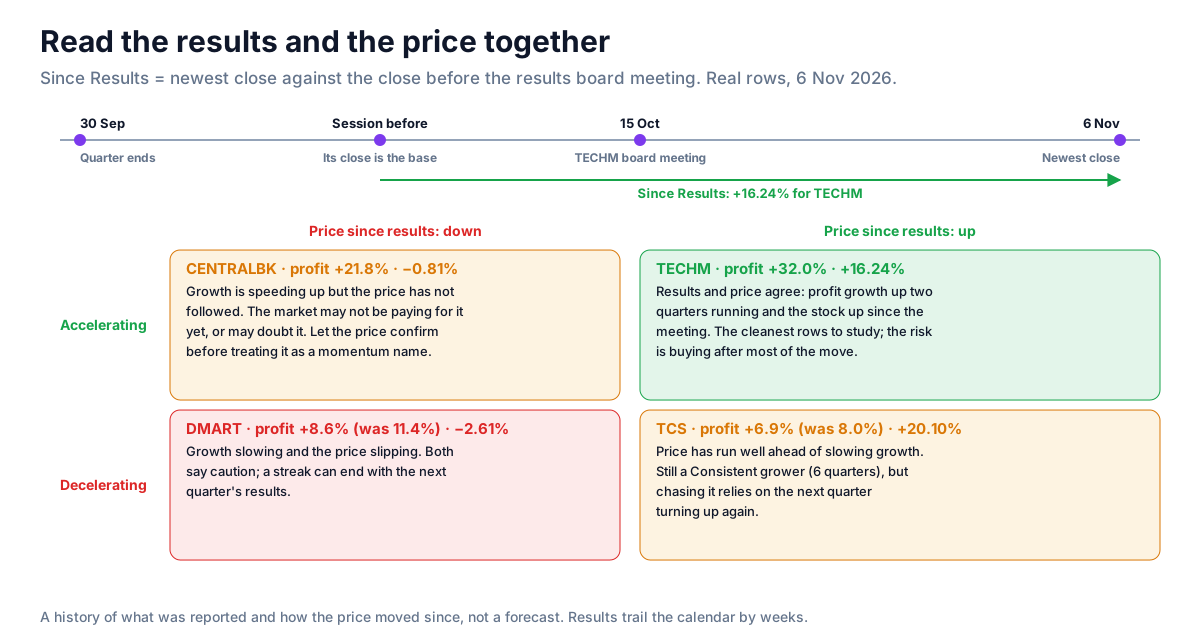
Since Results is the share price change from the close of the session before the results board meeting to the newest close. It answers a simple question: has the market agreed with the numbers? It is left blank if a split or bonus came in between, since that would read as a crash.
Real rows from the Q2 FY27 season, 6 November 2026
Results arrive over about six weeks after a quarter ends, so the page always says which quarter each row is from. On 6 November, 301 companies had filed Q2 FY27 results, against 2,317 for Q1 FY27. By default the page shows each company's newest quarter: 286 rows from Q2 FY27 and 1,858 from Q1 FY27 in the full list.
TECHM: Accelerating and Consistent
- Q2 FY27 (consolidated): sales ₹16,180 crore, +15.6%; profit ₹1,586 crore, +32.0%.
- Profit growth over four quarters: +31.9%, +18.6%, +29.8%, +32.0%. The last three rise, and the newest is above 15%: Accelerating. Acceleration +2.2 points.
- EBITDA margin 17.7%, up 2.0 points on a year ago.
- Growth Streak 4 quarters: Consistent too.
- Since Results +16.24%, from the close before its 15 October board meeting to 6 November.
Faster profit growth, a wider margin, a four-quarter streak and a price that has followed: every column points the same way. That agreement is what to look for, and also why the easy part of the move may already be in the price.
TCS: Consistent but Decelerating
- Q2 FY27: sales ₹73,188 crore, +11.2%; profit ₹13,884 crore, +6.9%.
- Profit growth: +11.6% (Q4 FY26), +8.0% (Q1 FY27), +6.9% (Q2 FY27). Down two quarters running: Decelerating. Acceleration −1.1 points.
- Growth Streak 6 quarters: Consistent.
- Since Results +20.10% from its 8 October meeting.
TCS is still growing and has grown every quarter for a year and a half. But the pace is slowing, and the price has risen 20% since results anyway. The two tags together describe a steady business whose growth is fading. The price move says the market was paying for something else, or for relief.
CENTRALBK: Accelerating, but the price has not followed
Profit growth of +21.8% after +9.9% and −28.4%: Accelerating, with acceleration of +11.9 points. Yet the price is −0.81% since its 17 October results. When the numbers improve and the price does not, either the market doubts the improvement or has not got to it yet. The page cannot tell you which.
BPCL: a Turnaround
BPCL lost ₹3,757 crore in Q1 FY27 and made ₹4,863 crore in Q2 FY27, so it is tagged Turnaround. Its profit growth reads −23.0% because the year-ago quarter was more profitable still: back in profit is not the same as back to where it was. The price is +11.48% since results.
A note on banks
For banks and finance companies, "sales" is interest earned and EBITDA comes before interest paid, so the EBITDA margin reads 80% or more (AXISBANK 84.8%) and says nothing about profitability. Read their sales and profit growth, and ignore the margin column.
How to use it in a trade
A step-by-step way to use the page:
- Check the quarter. Read the summary line first. Early in a season most rows are still last quarter's; a company listed as Accelerating on old numbers may report again next week. Use the Quarter filter to compare like with like.
- Start with Accelerating, then read the streak. Accelerating with a Growth Streak of four or more (TECHM) is improving growth inside a steady record. Accelerating straight out of a bad quarter (CENTRALBK, after −28.4%) is partly a base effect.
- Click the row. The panel shows the last four quarters' sales, profit, growth and margin. Look for growth that comes from sales and margin together, not from one quarter's tax or other income.
- Put the price beside it. Since Results tells you whether the market agreed. Numbers and price moving together are the clearer case; a gap between them is a question to answer before acting.
- Check the chart and the reaction. The Chart button marks the results date on the daily candles. The Results Reaction page shows how far the stock moved on the day against what options had priced.
- Plan around the next results. Earnings momentum is re-tested every quarter. Note the next results date on the Result Calendar; a position held into results is a bet on the next set of numbers too.
Strategy ideas (ideas, not promises)
These are ideas to study, paper-trade and backtest, not recommendations or signals, and not a promise of any result. Reported growth is history, results can be restated, and a price can fall on good numbers. Size, entries, exits and risk are your own decisions.
1. Accelerating and confirmed by price
- Setup: Accelerating, Growth Streak of 4 or more, EBITDA margin up on a year ago (outside banks), and Since Results positive.
- Entry idea: a pullback after results that holds above the results-day low, rather than the first days after the announcement.
- Invalidation: a close below the results-day low, or the next quarter's results breaking the acceleration.
- Pairs well with: the Relative Strength rating and the Trend Template, which check the price side.
2. Fundamentals ahead of price
- Setup: Accelerating with Since Results flat or negative (CENTRALBK on 6 November).
- Idea: a watch list, not an entry. Wait for the price to start agreeing, such as a move above the results-day high, before treating it as a momentum name.
- Test: compare how these rows did over the next quarter against idea 1's rows.
3. Consistent growers that are slowing
- Setup: Consistent and Decelerating at once (TCS, DMART).
- Idea: for holders, a reason to review, not an automatic sale. For new buyers, a reason to want a lower price or the next quarter turning up.
4. Turnarounds with a second quarter
- Setup: a Turnaround whose previous quarter was already a profit, so the loss is more than one quarter back.
- Idea: one profitable quarter after a loss is often noise; two in a row is the start of a record. Look again after the next results.
How to test these
Use the Quarter filter to look at a past quarter's tags, then compare what the tagged stocks did over the following three months with the rest of the list. Results trail the calendar, so use the price from after each company's results date, not from the quarter's end. Keep a record of the rows you skipped as well as the ones you took.
Every tab, filter and column
The tabs
- All: every company with a year-ago quarter to compare, fastest profit growth first.
- Accelerating: biggest acceleration first.
- Consistent Growers: longest streak first.
- Turnarounds: largest profit first.
- Decelerating: sharpest slowdown first.
The filters
- Quarter: "Each company's latest" (the default), or one quarter that at least 100 companies have filed, with the number of filers shown.
- Universe: All, Nifty 50, Nifty Next 50, Nifty Bank, F&O or Nifty 500.
On "Each company's latest", a company whose newest results are older than the last quarter most companies have filed is left out: it has probably stopped filing.
The columns
- Symbol, LTP, Sector: the stock, its close and change, its broad sector.
- Quarter: the results quarter, and "Cons." (consolidated) or "SA" (standalone).
- Sales: net sales for the quarter, ₹ crore.
- Sales YoY, Profit YoY: growth on the same quarter a year earlier; under Profit YoY, the previous quarter's growth.
- Acceleration: this quarter's profit growth minus last quarter's, in points.
- EBITDA Margin: this quarter's margin and its change on a year ago.
- Growth Streak: quarters in a row with sales and profit both up; highlighted at four or more.
- Since Results: the price change since the close before the results meeting, with the meeting date below.
- Signal: Accelerating, Consistent, Turnaround, Decelerating.
- Chart: the daily candles with the results date marked.
Click any row for its last four quarters: sales, profit, both growth rates and the margin.
What the numbers are built from
Quarterly results (three-month periods only) come from Unfluke's company financials database, matched to NSE symbols through the company profiles. Each company is read on one basis: consolidated results where it files them, standalone where it files only those, or where the standalone results are newer or the consolidated set lacks the year-ago quarter. The results date is the first results board meeting within 100 days after the quarter ended, from NSE's board meeting announcements. Prices are the newest NSE Bhavcopy close.
- The data trails the calendar. A season takes about six weeks, and figures reach the database after each filing, so early in a season most rows are from the previous quarter. The summary line always says how many companies have filed the newest one.
- Financial companies. The EBITDA margin is not meaningful for banks, NBFCs and insurers.
- Restatements. A company can restate a past quarter, which changes its growth rates and tags.
Where to go next
For how a stock moved on its results day, read the Results Reaction guide; for the dates, the Result Calendar guide; for balance-sheet quality, the Piotroski and Altman guide; and for the price side, the Relative Strength guide. Open the page at Watch List → Earnings Momentum, or sign up free to use every filter.
More from the blog
- Strategy Backtesting on Unfluke
Backtest trading strategies on real Indian market data with Unfluke. Test equity, Nifty, Bank Nifty and options strategies with realistic costs and key metrics.
- Live Market Scanners
Explore Unfluke's real-time stock scanner for NSE markets. Scan 1,800+ stocks with 40+ technical indicators, fundamental filters, F&O data and custom rules.
- Option Strategy Simulator
Build and simulate multi-leg options strategies with Unfluke. Visualize payoffs, Greeks, max profit and loss, and replay historical option data from 2023.