Market Terminal
Results Calendar: How to Read Upcoming Quarterly Results Dates
9 min read · Updated 2 Nov 2026
The Result Calendar shows, day by day for any month, which listed companies have scheduled a board meeting to approve their financial results.
This guide explains what the calendar is, how to read each part of the page, and how it fits into research around earnings season.
What is a results calendar?
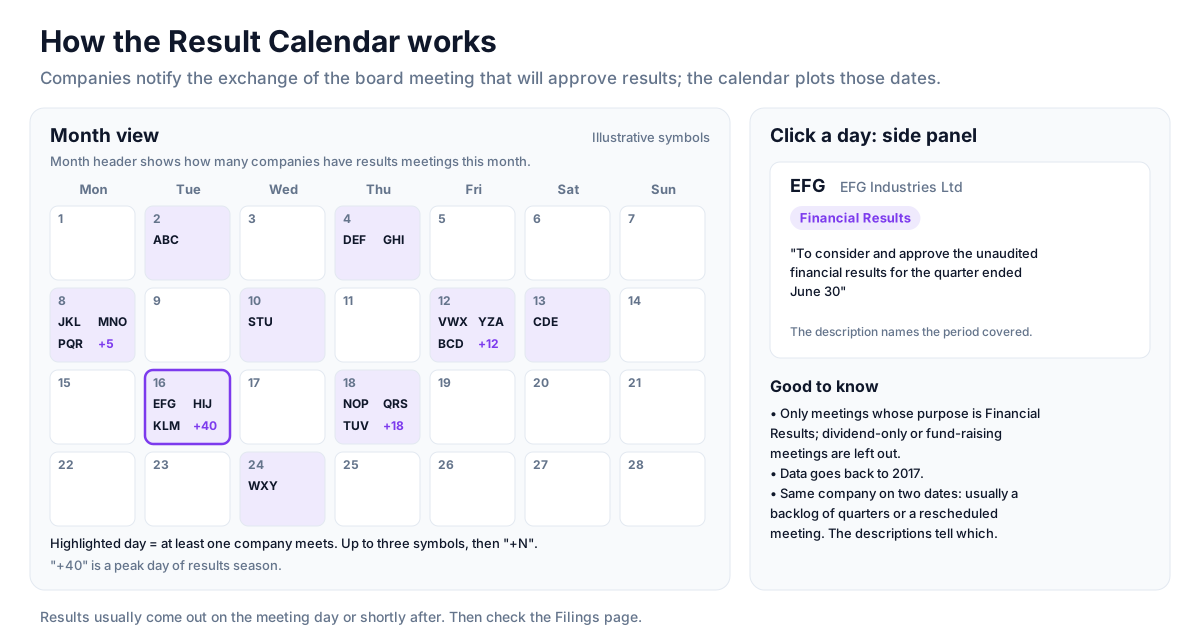
Before a listed company publishes its quarterly or annual results, its board of directors meets to approve them. Companies must tell the exchange the date of that meeting in advance, and the results are usually released on the meeting day or shortly after.
Unfluke's calendar plots those notices. It shows only meetings whose stated purpose is Financial Results - not meetings called only for dividends, fund raising or other business - and covers data back to 2017.
How to read it
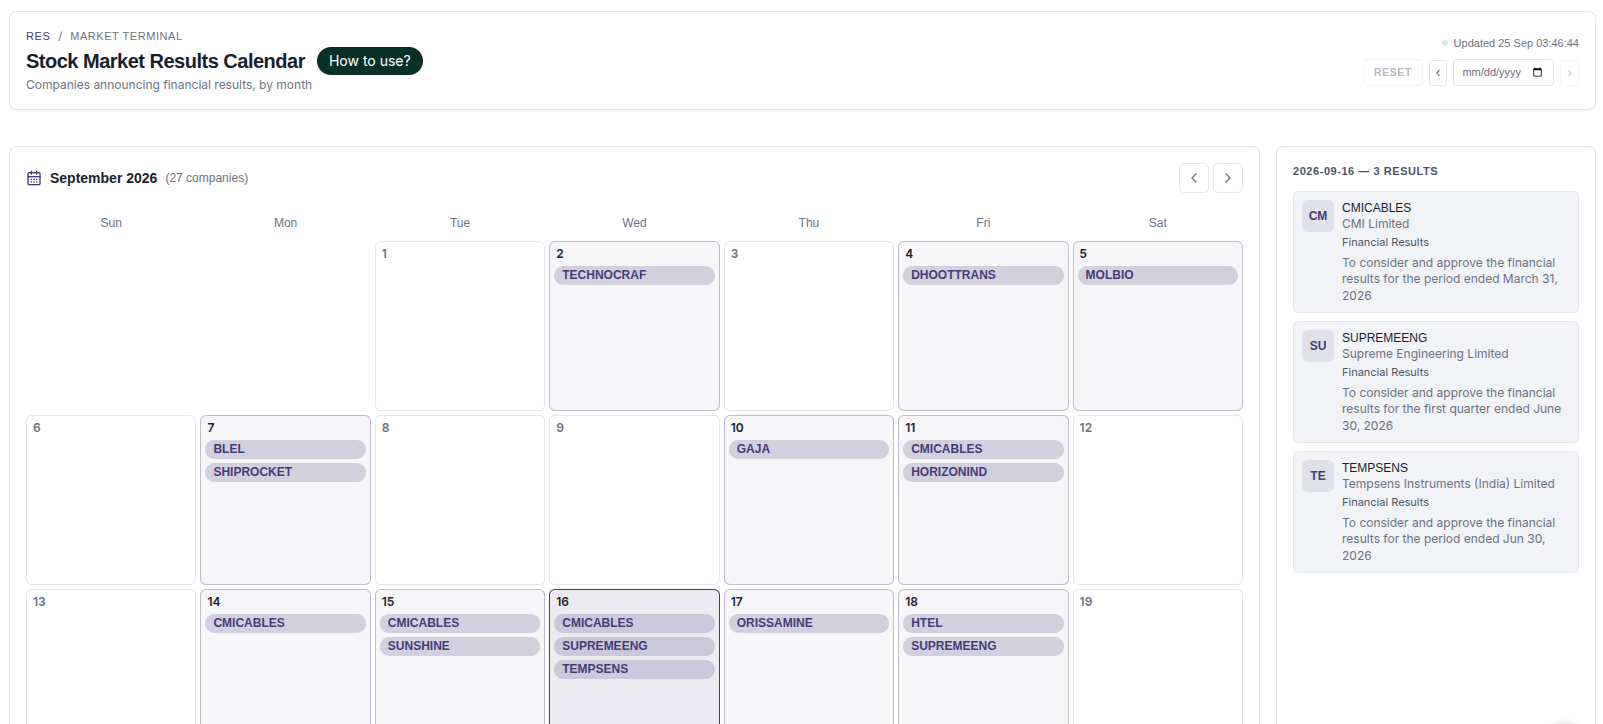
- Month header - the month on screen and how many companies have results meetings in it. Use the arrows to move between months, or the date picker to jump to a day.
- Day boxes - a highlighted box means at least one company meets that day. Up to three symbols are shown in the box, with "+N" when there are more.
- Side panel - click a day to list every company meeting on it, with the number of results that day.
- Company card - symbol, company name, the purpose ("Financial Results") and the description the company filed, which usually states the period the results cover (for example "the quarter ended June 30").
Using the page for research
- At the start of a week, scan the next few days for companies on your watchlist so no results date comes as a surprise.
- Open the company card and read the description to confirm which period is being reported.
- Note especially busy days - many companies reporting together can mean heavier news flow across a sector.
- After the meeting, check the Filings page to see when the results were actually submitted.
Why a company can appear on more than one day
A company sometimes shows up on several dates in the same month. Common reasons are catching up on overdue filings (one meeting per pending quarter) and meetings that were rescheduled after being announced. The description on each card usually makes the reason clear, because it names the period being approved.
Results dates and event risk
Results often lead to some of the largest single-day price moves of the quarter, and the date is known in advance. For that reason many market participants treat a results date as a known event when reviewing their own exposure. For stocks that trade in F&O, implied volatility on the Option Chain often rises into the date and falls after it - see how implied volatility behaves around events.
Strategy ideas (ideas, not promises)
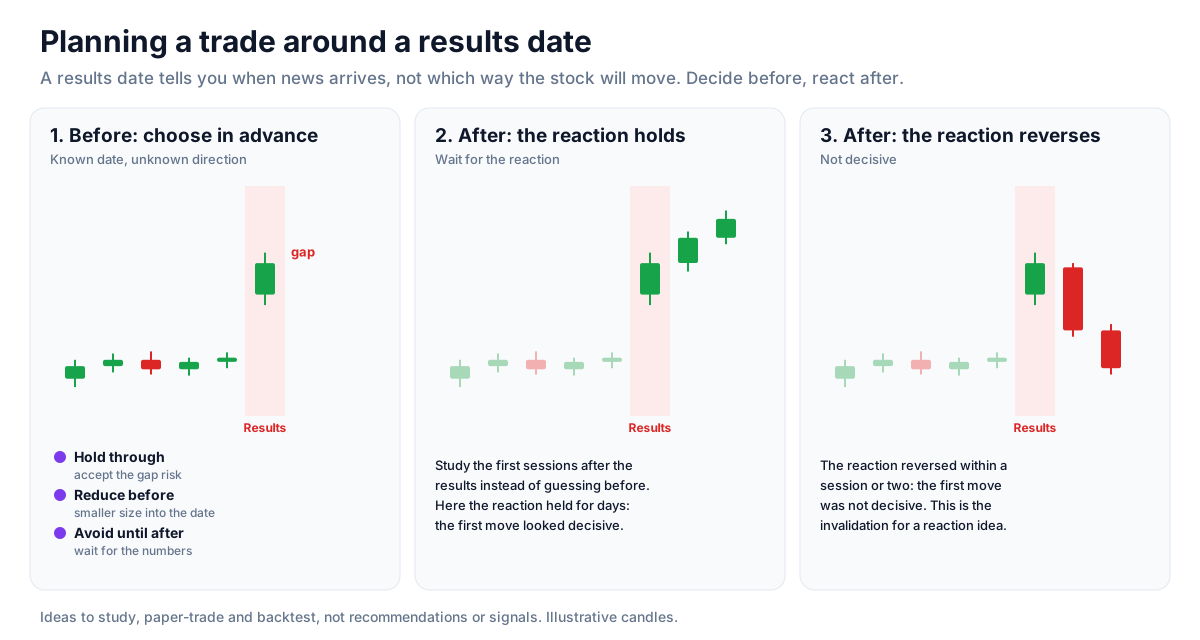
These are ideas to study, paper-trade and backtest, not recommendations or signals, and not a promise of any result. A results date marks when news arrives, not which way the stock will move. Size, entries, exits and risk are your own decisions.
1. Know the date before taking a position
- Setup: check the Result Calendar for every stock you plan to trade over the next few weeks.
- Reading: a position held through the results meeting carries a known event risk that can gap the price.
- Use: decide in advance whether to hold through, reduce before, or avoid until after the numbers.
2. Wait for the reaction instead of guessing
- Setup: a watchlist stock with a results meeting this week.
- Entry idea: let the results come out and study the first sessions after them, rather than taking a view before the numbers.
- Invalidation: a reaction that reverses within a session or two shows the first move was not decisive.
3. Use busy days as a sector read
- Setup: a day with many companies from one sector reporting together.
- Reading: several results in the same industry on one day often move the sector as a group; one company's numbers can shift its peers.
4. Confirm the period and the filing
- Setup: open the company card for the period being approved, then check the Filings page after the meeting.
- Reading: a company clearing a backlog of old quarters is a different event from a regular quarterly result.
How to test these
Pick past results dates from the calendar, then use the Historical Charts to see how the stock moved on the day after and over the following week. Note how often the first day's direction held.
Where to go next
Read studying volatility around results next, or return to the reference data guide. Try the Result Calendar free.
How to Read This Data
A result calendar shows when listed companies are scheduled to announce their quarterly results. Results can change expectations about a business, which is why prices often move more than usual around these dates.
- Note the result dates for companies you are studying.
- Compare the price move on result days with the stock's typical daily move.
- Read the results filing itself; the calendar only gives the date.
- Remember that companies sometimes reschedule; check the exchange filing for the confirmed date.
Limitations: The calendar shows timing, not content. It cannot indicate whether results will be good or bad, or how the market will react.
More from the blog
- Strategy Backtesting on Unfluke
Backtest trading strategies on real Indian market data with Unfluke. Test equity, Nifty, Bank Nifty and options strategies with realistic costs and key metrics.
- Live Market Scanners
Explore Unfluke's real-time stock scanner for NSE markets. Scan 1,800+ stocks with 40+ technical indicators, fundamental filters, F&O data and custom rules.
- Option Strategy Simulator
Build and simulate multi-leg options strategies with Unfluke. Visualize payoffs, Greeks, max profit and loss, and replay historical option data from 2023.