Market Terminal
Expiry Day OI Shift: How Open Interest Rolls Into the Next Expiry, and Where the Walls Move
11 min read · Updated 9 Nov 2026
On an expiry day two things happen at once. The expiring options unwind: positions are closed or left to settle. And the next expiry fills up, as writers and buyers set up for the week or month ahead. Where that new open interest lands is the first draft of the next expiry's support and resistance.
The Expiry Day OI Shift page shows both halves for any past expiry of NIFTY, the other indices or an F&O stock: how much OI left the expiring series, how much arrived in the next, strike by strike, and where the call and put walls (the strikes holding the most OI) sat before, on and after the day. This guide reads NIFTY's real 3 November 2026 weekly expiry and turns it into a workflow and strategy ideas.
What the expiry-day shift is
Two series, three sessions
The page compares the same strikes across three end-of-day snapshots:
- The day before expiry: the expiring series near its peak, the next series still light.
- Expiry day: the last session the expiring contracts traded (the expiry date, or the day before it when the expiry falls on a holiday).
- The day after: the next series as the new front series, with the expired one gone.
The next series is the expiry that follows the one you picked, as listed on expiry day: for NIFTY's weekly options that is the next weekly.
Walls
A call wall is the strike holding the most call OI in a series, and a put wall the strike holding the most put OI. Option writers hold most of that OI, so traders read the call wall as resistance and the put wall as support: the writers lose if price goes through them, and some defend them by hedging. They are where positions are, not barriers price cannot cross.
Max pain
The page also shows the expiring series' max pain on the day before: the strike at which option buyers' holdings would be worth the least at expiry, computed from that day's OI. Many traders expect expiry to settle near it. The page shows how far the expiry-day close finished from it, so you can judge that idea expiry by expiry (see the max pain guide).
Reading a real expiry: NIFTY, 3 November 2026
NIFTY's weekly expiry on Tuesday 3 November 2026 came in the middle of a sharp rally. The page, with NIFTY, expiry 3 Nov and 5 sessions, read:
- Expiry-day close: 23,810.85, +1.58% on the day before's 23,440.80. Max pain the day before was 23,250, so the close finished 2.41% above it: no pull to max pain on a trending day.
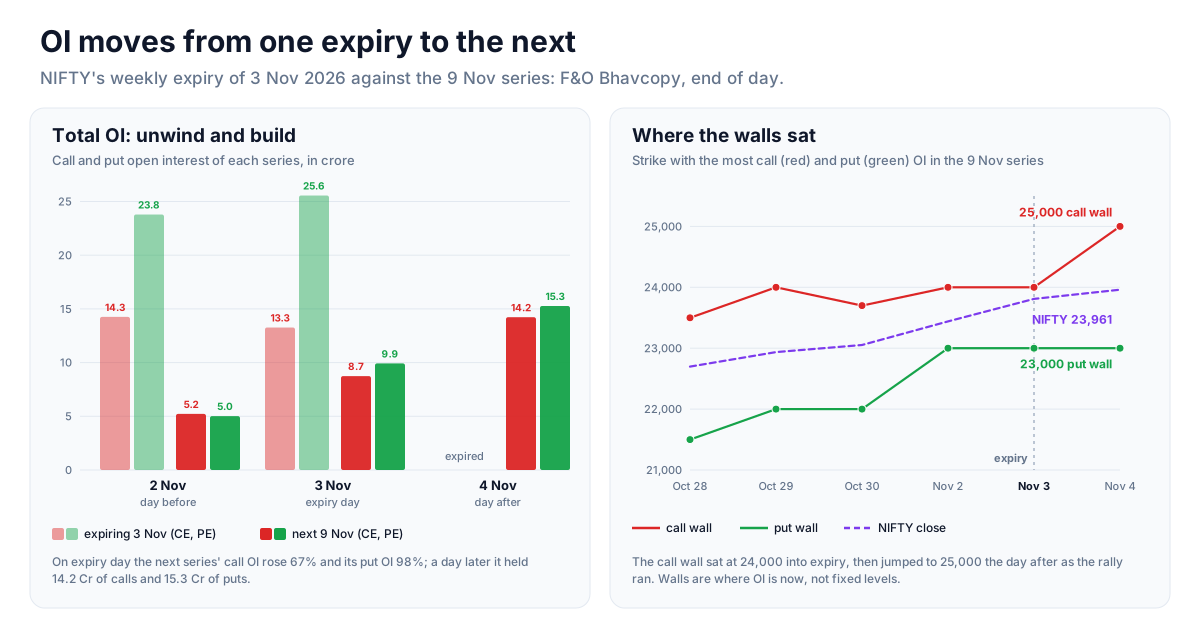
- Expiring series OI: calls 14.26 Cr → 13.27 Cr (−6.93%), puts 23.79 Cr → 25.56 Cr (+7.46%). PCR 1.668 → 1.926. Put writers were still selling into the rally on its last day.
- Next expiry OI (9 Nov): calls 5.22 Cr → 8.74 Cr → 14.22 Cr, puts 5.02 Cr → 9.92 Cr → 15.27 Cr (day before → expiry day → day after). On expiry day alone, calls +67% and puts +98%.
- Next expiry walls: call wall 24,000 → 24,000 → 25,000; put wall 23,000 → 23,000 → 23,000.
Strike by strike
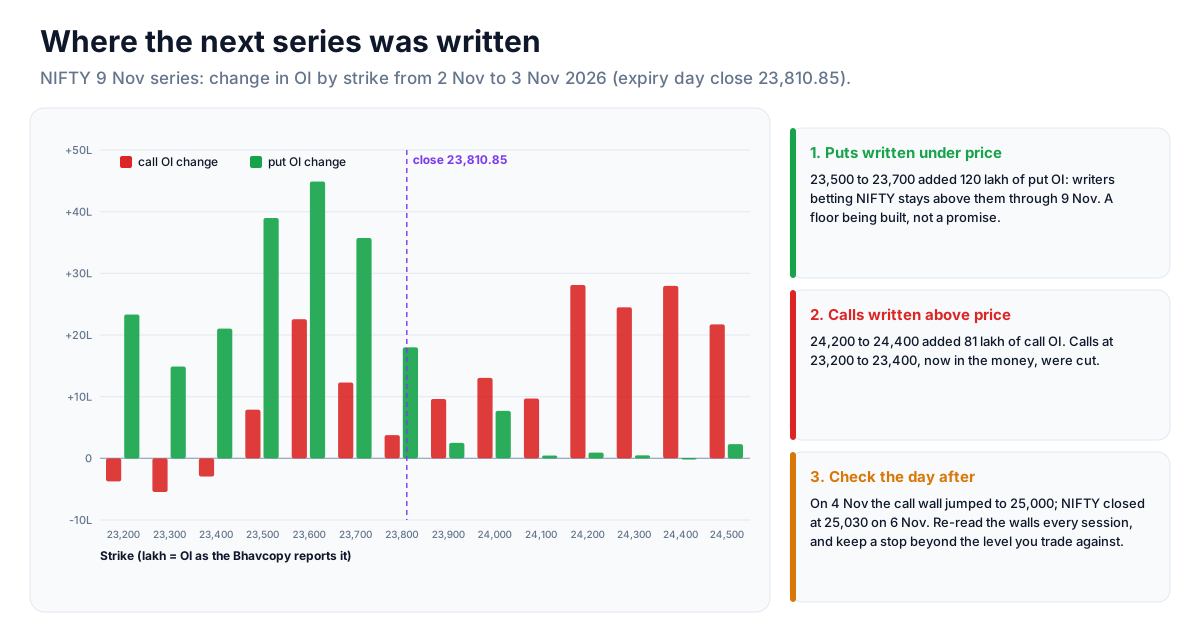
The "OI change by strike" chart (next expiry, day before → expiry day) shows where the new money went:
- Puts written under price: 23,600 +44.89 L, 23,500 +38.98 L, 23,700 +35.73 L. Writers were betting NIFTY would stay above 23,500 to 23,700 through 9 November.
- Calls written above price: 24,200 +28.11 L, 24,400 +27.96 L, 24,300 +24.50 L.
- Calls cut below price: 23,300 −5.46 L, 23,200 −3.74 L, 23,400 −2.95 L. Those calls were in the money after the rally, and their writers were closing them.
In the expiring series the biggest unwinds were calls at 23,500 (−98.1 L), 23,400 and 23,600: writers covering calls that the rally had pushed into the money.
What happened next
On 4 November, the day after, the call wall jumped from 24,000 to 25,000 as the rally carried on. NIFTY closed at 25,030.35 on 6 November, above that wall, three sessions before the 9 November expiry. The put build at 23,500 to 23,700 was never tested. Walls are a map of where positions sit today; in a trend they move with price.
A quieter expiry for contrast
The 27 October monthly expiry is the opposite case. Max pain the day before was 22,750, and NIFTY closed at 22,749.75, almost exactly on it. The expiring series' call OI fell 14.1% and its put OI 21.5% on the day, and the next series' call wall moved from 23,000 to 23,500. The same page, two expiries: one range-bound and pinned, one trending straight through.
How to use it in a trade
- Pick the expiry you want to study. The newest is selected by default; the list is tagged Weekly or Monthly. Monthly expiries carry the stock options and most index futures roll, so they show the biggest shifts.
- Read the summary cards first. How far did the close finish from max pain? Did the expiring series unwind evenly, or did one side keep building into the last day?
- Find the new walls. The fourth card shows the next series' call and put walls on the day before, expiry day and the day after. The day-after reading is usually the more settled one, since expiry-day OI is still arriving.
- Look at where OI was added, not only the biggest strike. In the strike chart a cluster of put writing just under price, as at 23,500 to 23,700, says more about where writers expect support than one large, far-away strike.
- Read the intraday panel when it is loaded. It samples the expiry day every 15 minutes from the 1-minute option archive, with a table of each time a wall moved. A wall that moved late in the day is less settled than one that held from the open.
- Carry it forward. Use the walls as reference levels on the live Open Interest page in the following sessions, and re-check them every day; a stop belongs beyond the level you are trading against, not on it.
Strategy ideas (ideas, not promises)
These are ideas to study, paper-trade and backtest, not recommendations or signals, and not a promise of any result. Walls move, max pain often fails on trending days, and option writing can lose far more than the premium received. Size, entries, exits and risk are your own decisions.
1. Range between the new walls
- Setup: after an expiry, the next series' call and put walls both held from the day before to the day after, with the close between them.
- Idea: a defined-risk range trade (an iron condor) with the short strikes at or outside the walls.
- Invalidation: a close beyond either wall, or the wall itself moving.
2. Trend confirmation from a moving wall
- Setup: the call wall moving up (24,000 to 25,000 on 4 November 2026) while the put wall rises or holds.
- Reading: writers are giving ground in the direction of the move. Favour trend-following trades and avoid selling calls against the move.
- Invalidation: the put wall dropping back, or put OI unwinding below price.
3. Max pain on quiet expiries only
- Setup: the day before expiry, a close near max pain after several range-bound sessions (27 October 2026: max pain 22,750, close 22,749.75).
- Test: go back through past expiries on the page and record the distance from max pain to the expiry-day close, split by whether the week before trended or ranged. The split, not the average, is what tells you when to rely on it.
4. Put writing under price as a support map
- Setup: a cluster of put OI added just below the expiry-day close in the next series.
- Idea: use the cluster as a zone for buying dips on your own chart signals, with a stop below the lowest strike of the cluster.
How to test these
Step through past expiries with the Expiry box and export the strike changes to CSV. For each idea, write down the condition, the entry and the exit, and record the outcome over the following expiry. Build the option structure in the Option Simulator and backtest it on Unfluke before trading real money.
Every control and panel
The controls
- Underlying: NIFTY by default, any index or F&O stock with options, with arrows to step through the list.
- Expiry: up to the last 60 past expiries of that underlying, newest first, each tagged Weekly or Monthly (the last expiry of its calendar month).
- Sessions: 3, 5 (default), 8, 10 or 15 sessions into expiry on the walls chart.
The summary cards
- Expiry-day close, its change on the day before, and the max pain of the expiring series the day before with the close's distance from it.
- Expiring series OI: call and put OI change from the day before to expiry day, and PCR on both days.
- Next expiry OI: call and put OI on the day before, expiry day and the day after, the change on expiry day, and PCR on all three.
- Next expiry walls: the call and put walls on expiry day, with their path across the three sessions.
The panels
- Call and put walls into expiry: the walls of both series and the underlying's close over the chosen sessions and the day after, with the expiry marked.
- Wall table: the same, session by session, with the PCR of each series.
- OI change by strike: compare the next expiry from the day before to expiry day, the next expiry from expiry day to the day after, or the expiring series from the day before to expiry day; show ATM ± 10, 15, 20 or 30 strikes, or all; export to CSV. Only strikes within 15% of the price are included.
- Expiry day, minute by minute: total call and put OI of either series every 15 minutes against the underlying, each strike's OI at the first and last sample, and the times a wall moved.
What the numbers are built from
The daily panels are end of day, from NSE's F&O Bhavcopy: the open interest of every strike of the two series on each session, as the Bhavcopy reports it (shown in lakh and crore). PCR is total put OI ÷ total call OI of the series. Max pain is computed from the expiring series' OI on the day before. The intraday panel reads the 1-minute option archive, which is loaded in batches and trails the calendar; when an expiry day is not loaded yet, the panel says how far the archive reaches. The page covers past expiries only and has no live mode.
Where to go next
For walls and OI through a live session, read the Open Interest guide and the max pain guide; for the put-call ratio, the PCR guide; and for selling the expiry-week premium, the short straddle guide. Open the page at Open Interest → Expiry Day OI Shift, or sign up free to run it yourself.
More from the blog
- Strategy Backtesting on Unfluke
Backtest trading strategies on real Indian market data with Unfluke. Test equity, Nifty, Bank Nifty and options strategies with realistic costs and key metrics.
- Live Market Scanners
Explore Unfluke's real-time stock scanner for NSE markets. Scan 1,800+ stocks with 40+ technical indicators, fundamental filters, F&O data and custom rules.
- Option Strategy Simulator
Build and simulate multi-leg options strategies with Unfluke. Visualize payoffs, Greeks, max profit and loss, and replay historical option data from 2023.