Market Terminal
Put Call Ratio (PCR) Explained: Reading PCR Today and Its Extremes
10 min read · Updated 2 Nov 2026
The PCR & Max Pain page shows the put call ratio for a symbol such as NIFTY - minute by minute within a session, or session by session over a chosen range - for all expiries combined and for the nearest expiry alone.
This article explains what PCR is, how to read the page, and how unusually high or low readings are commonly interpreted.
What is the put call ratio?
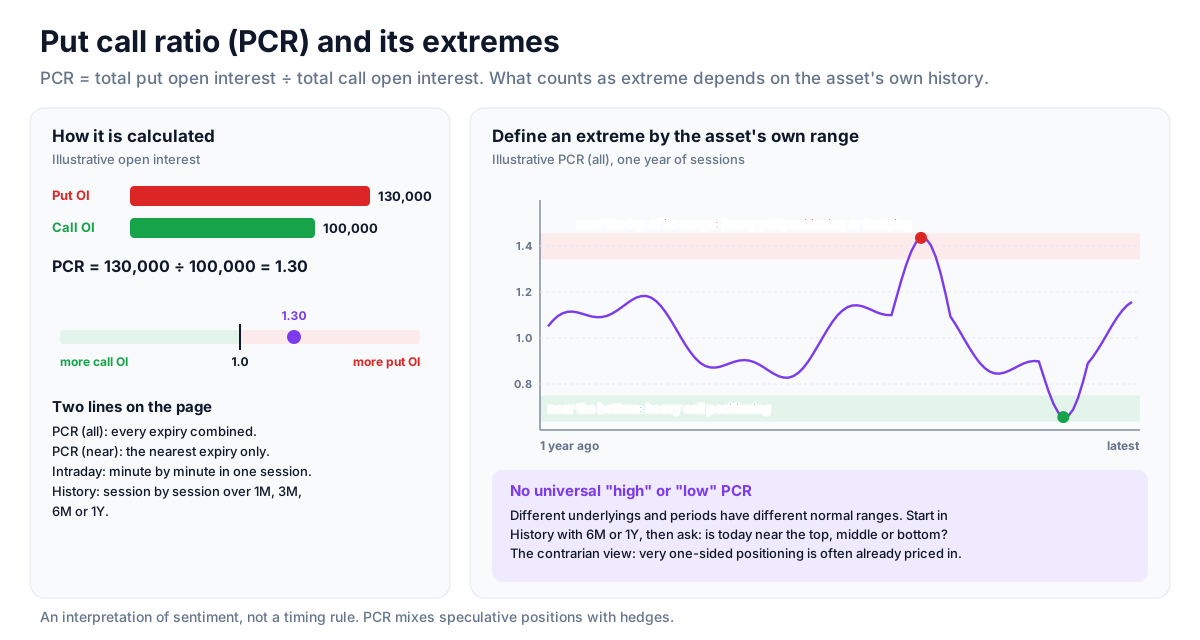
The put call ratio (PCR) divides total put open interest by total call open interest. A PCR above 1 means more put OI than call OI; below 1 means the opposite. It is widely followed as a gauge of options-market positioning and sentiment.
Unfluke's page tracks two versions: PCR (all) across every expiry, and PCR (near) for the nearest expiry only. Values are computed from stored per-minute option data; the stored archive currently runs to 31 August 2026, and when a picked date has no data the page shows the most recent session that does. The Max Pain view is not shown on the page at the moment.
How to read it
- Symbol - type the underlying, for example NIFTY.
- Intraday / History - switch between one session minute by minute (pick the date) and a range of sessions (1M, 3M, 6M or 1Y).
- Close PCR (all expiries) and Close PCR (near expiry) - the 15:29 readings for the session, with the near expiry named underneath.
- Minutes Stored - how many minutes of data the session has, and the first and last time.
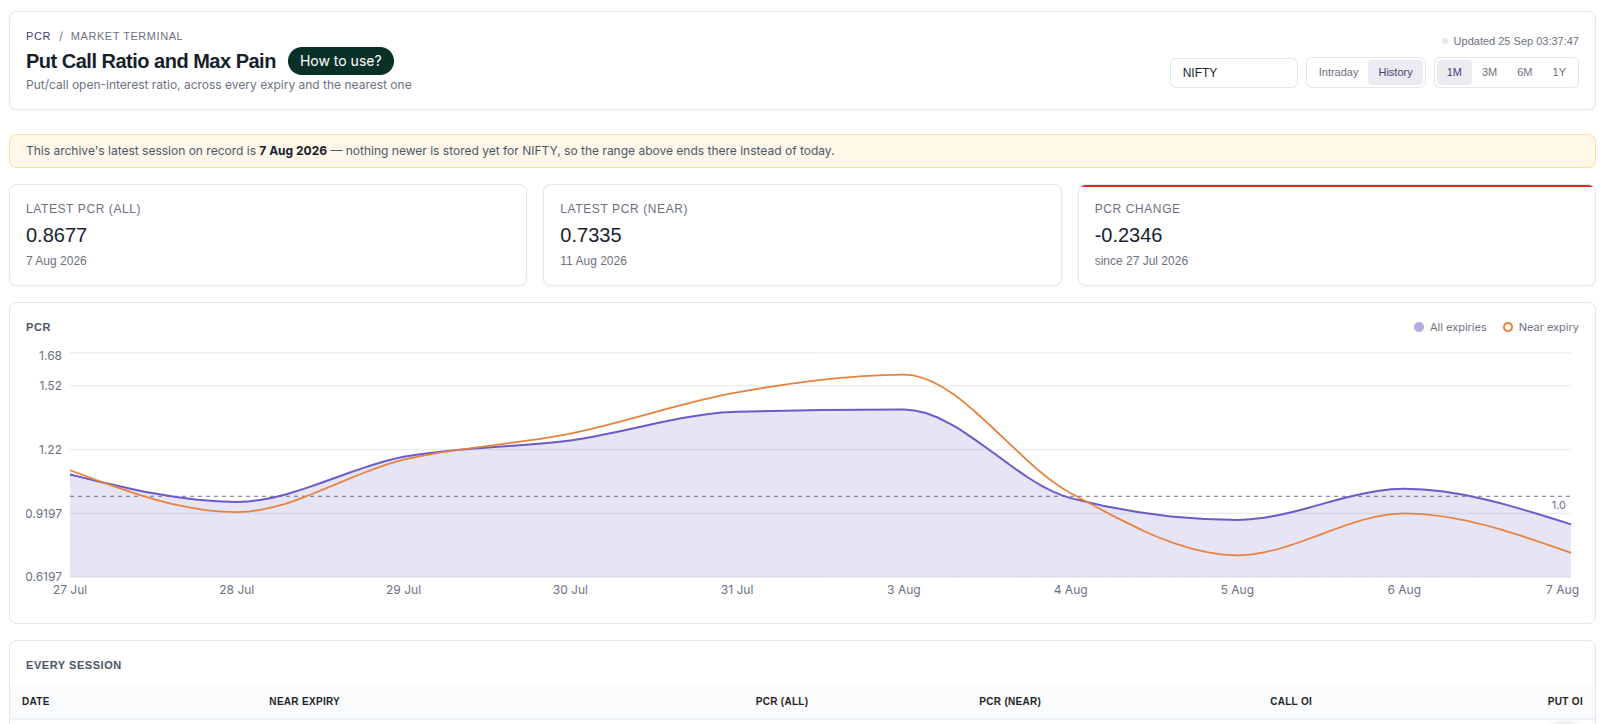
- Latest PCR (all / near) and PCR Change - in History, the latest values and how much PCR (all) has changed since the start of the range.
- PCR chart - one line for all expiries and one for the near expiry, by minute or by session.
- Every Session table - Date, Near Expiry, PCR (all), PCR (near), Call OI and Put OI.
How to use it
Start in History with a 6M or 1Y range to see where PCR normally sits for that symbol. Then note whether the latest reading is near the top, middle or bottom of that range. If a session stands out, switch to Intraday for that date to see how PCR moved through the day and whether the near-expiry line behaved differently from the all-expiry line.
How extreme PCR readings are usually interpreted
A very high PCR reflects heavy put positioning or hedging; a very low PCR reflects heavy call positioning. A widely discussed contrarian view is that when positioning becomes very one-sided, much of that sentiment is already in the market, so extremes have sometimes appeared near turning points. It is an interpretation of sentiment, not a timing rule.
Defining an extreme using the symbol's own history
There is no universal "high" or "low" PCR. Different underlyings and different market periods have different normal ranges. Using the History view's own range - for example, whether a reading is near the top or bottom of the last six months - gives a more meaningful comparison than a fixed textbook number.
Looking inside a session
The close reading hides how PCR moved during the day. The Intraday view shows whether a high close came from a steady build through the session or a late shift, which changes how the reading is usually interpreted.
Limits of PCR
Extreme readings can persist or become more extreme during strong trends, and PCR mixes speculative positions with hedges. It is most useful as one input next to price action and the near-vs-all-expiry comparison, rather than on its own.
Strategy ideas (ideas, not promises)
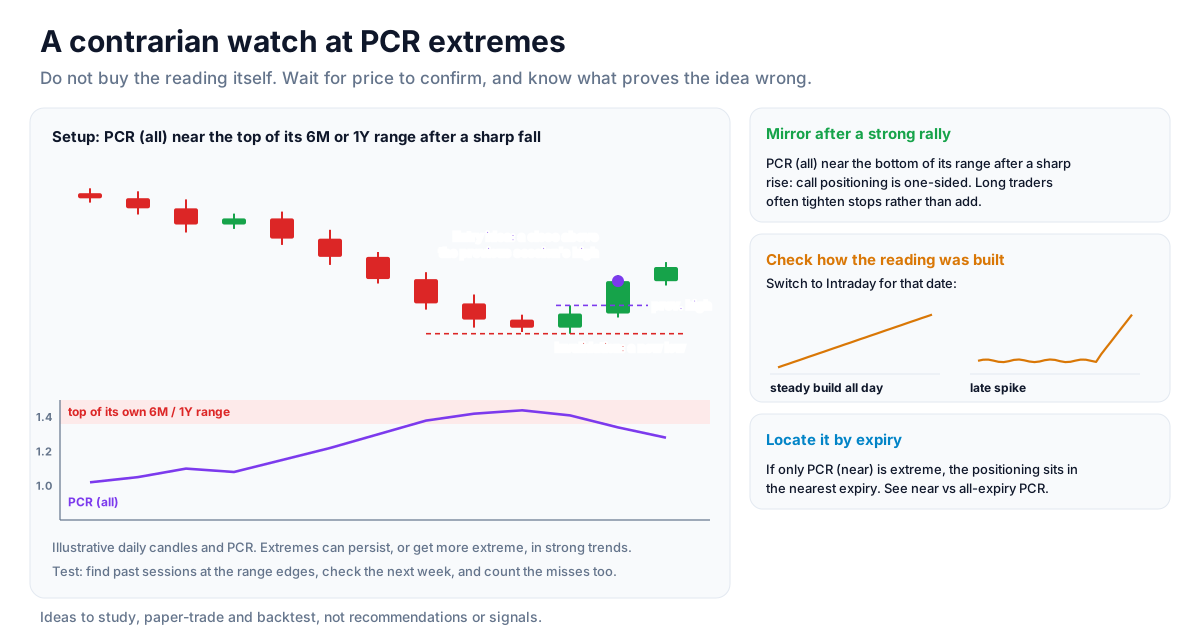
These are ideas to study, paper-trade and backtest, not recommendations or signals, and not a promise of any result. Extreme PCR readings can persist, or get more extreme, in strong trends. Size, entries, exits and risk are your own decisions.
1. Contrarian watch at the symbol's own extremes
- Setup: PCR (all) near the top of its 6M or 1Y range after a sharp fall in the index.
- Entry idea: wait for price to confirm, such as a close above the previous session's high, rather than buying the reading itself.
- Invalidation: a new low after the signal.
2. The mirror after a strong rally
- Setup: PCR (all) near the bottom of its range after a sharp rise.
- Reading: call positioning is one-sided; long traders often tighten stops rather than add.
3. Check how the reading was built
- Idea: switch to Intraday for that date: a steady build through the session reads differently from a late spike.
4. Locate it by expiry
- Reading: if only PCR (near) is extreme, the positioning sits in the nearest expiry; see near vs all-expiry PCR.
How to test these
In History, find past sessions when PCR reached the top or bottom of its range, then check what the index did over the following week. Count the misses, not just the hits.
Where to go next
Read reading the PCR trend alongside price for a different use of the same data. Try the PCR page free.
How to Read This Data
The put-call ratio (PCR) divides put open interest by call open interest; max pain is the strike at which option holders as a group would lose the most at expiry. Both summarise how options positions are distributed, and analysts use them to study sentiment.
- Compare PCR for the nearest expiry with PCR across all expiries; they can differ meaningfully.
- Track how PCR changed through the session rather than reading one value.
- Note how far max pain sits from the current price and whether it moves as expiry approaches.
- Read both measures alongside the open-interest distribution they are built from.
Limitations: PCR and max pain are summary statistics of positioning, not predictions. Unusual readings can persist, and the index often settles far from max pain.
More from the blog
- Strategy Backtesting on Unfluke
Backtest trading strategies on real Indian market data with Unfluke. Test equity, Nifty, Bank Nifty and options strategies with realistic costs and key metrics.
- Live Market Scanners
Explore Unfluke's real-time stock scanner for NSE markets. Scan 1,800+ stocks with 40+ technical indicators, fundamental filters, F&O data and custom rules.
- Option Strategy Simulator
Build and simulate multi-leg options strategies with Unfluke. Visualize payoffs, Greeks, max profit and loss, and replay historical option data from 2023.