Market Terminal
FII Net Buying and Selling Streaks: What They Can Tell You
8 min read · Updated 2 Nov 2026
Individual daily FII numbers are noisy, but sustained streaks - five, ten or fifteen consecutive sessions of net buying or selling - are a different matter. The FII/DII page makes these streaks easy to spot.
What counts as a streak
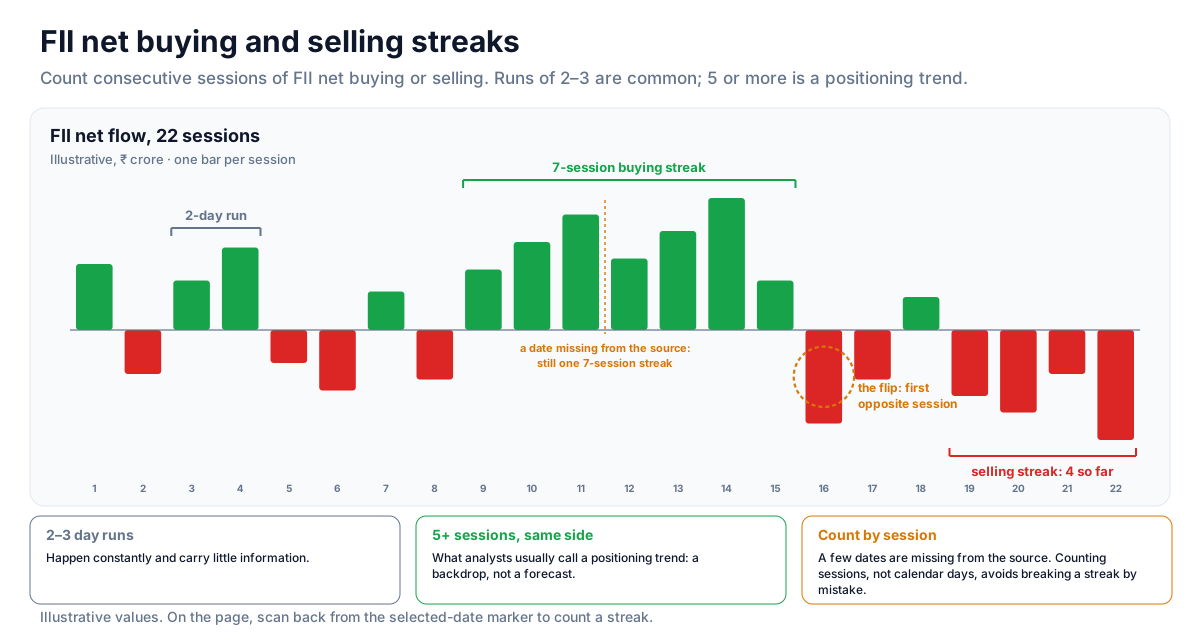
Counting consecutive sessions of net FII buying or selling in the session table is the simplest measure. Runs of two or three days happen constantly and carry little information; a run of five or more sessions in the same direction is what analysts usually call a positioning trend. Because a few dates are missing from the source data, counting by session rather than by calendar day avoids breaking a streak by mistake.
Seeing the streak on the chart
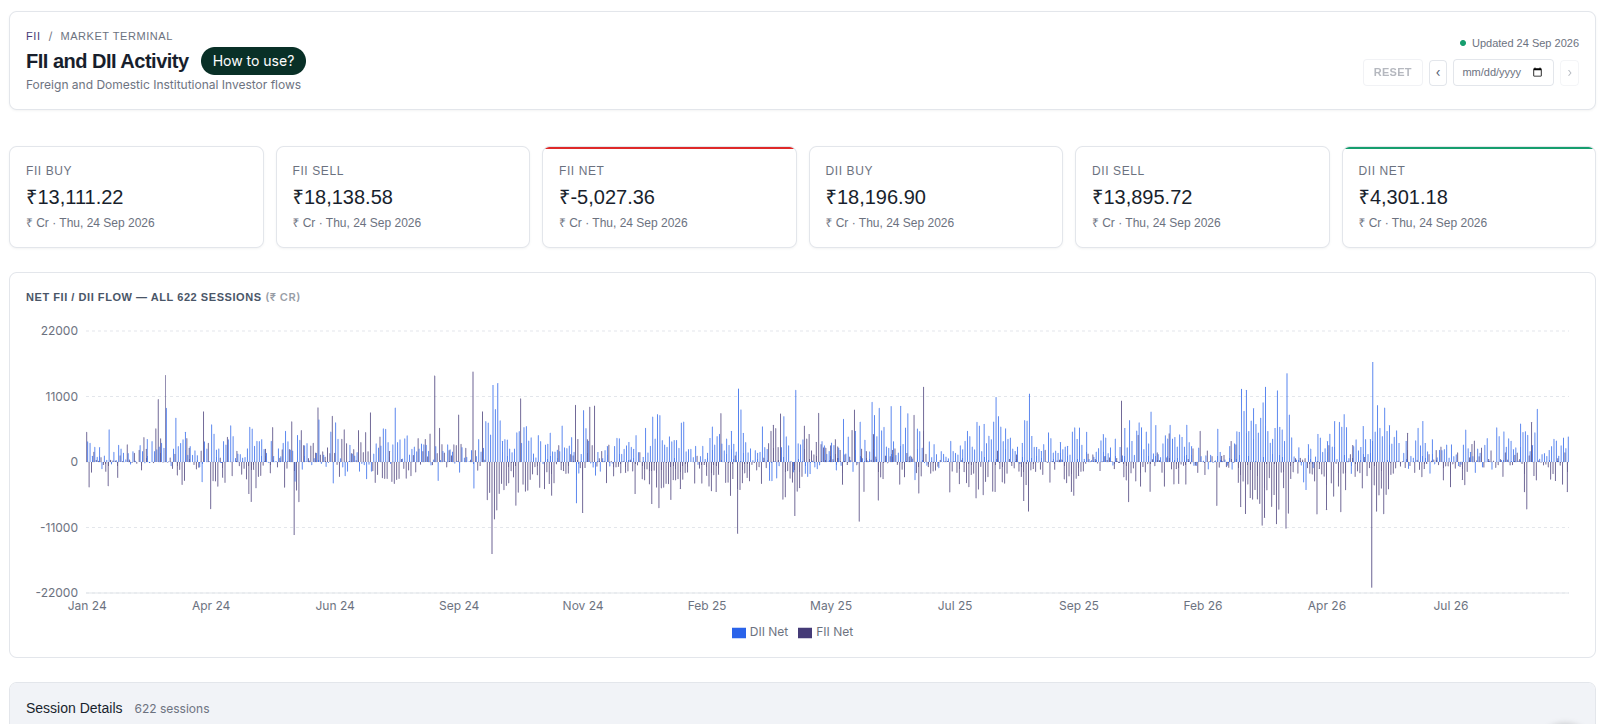
The net-flow chart makes streaks visible without reading rows: scanning back from the marker for the selected date shows how many consecutive FII bars sit on the same side of zero.
Concept: streaks as market context
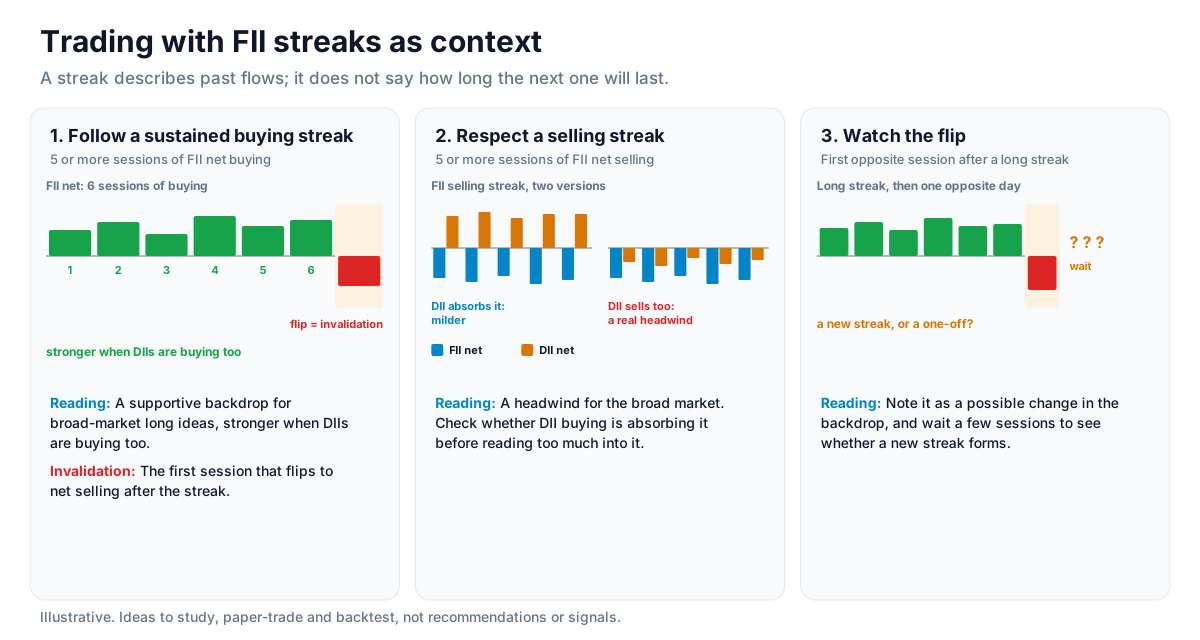
Market commentary often describes a sustained buying streak as a supportive backdrop for the broad market, and a sustained selling streak as a headwind. For the same reason, the end of a long streak - the first session that flips direction - is usually noted as a change in that backdrop. A streak describes past flows; it does not say how long the next one will last.
Using DII flows as a check
An FII streak reads very differently depending on what DIIs are doing - see how to read FII and DII flows. A long FII selling streak fully absorbed by DII buying is a much milder backdrop than the same streak with DIIs also selling.
Strategy ideas (ideas, not promises)
These are ideas to study, paper-trade and backtest, not recommendations or signals, and not a promise of any result. A streak describes past flows; it says nothing about how long the next one will last. Size, entries, exits and risk are your own decisions.
1. Follow a sustained buying streak
- Setup: Five or more consecutive sessions of FII net buying.
- Reading: A supportive backdrop for broad-market long ideas, stronger when DIIs are buying too.
- Invalidation: The first session that flips to net selling after the streak.
2. Respect a selling streak
- Setup: Five or more sessions of FII net selling.
- Reading: A headwind for the broad market; check whether DII buying is absorbing it before reading too much into it.
3. Watch the flip
- Setup: The first opposite-direction session after a long streak.
- Reading: Note it as a possible change in the backdrop and wait a few sessions to see whether a new streak forms.
How to test these
Count streaks by session (not calendar day) in the table's history, then check how Nifty 50 moved during and after each streak of five sessions or more.
Where to go next
Return to how to read FII DII data or the full equity data guide. Sign up free to follow the flows.
How to Read This Data
FII and DII data shows the net buying or selling of foreign and domestic institutional investors each day. Analysts study it to understand broad institutional participation; a single day is often noisy, so the pattern over several sessions is usually more informative.
- Look at net flows over several consecutive sessions rather than one day's number.
- Compare FII and DII flows; they often move in opposite directions.
- Compare the flow pattern with the index over the same period.
- Note the scale of a day's flow against its usual range before calling it unusual.
Limitations: These are aggregate, provisional figures. They do not show individual participants, intentions or derivatives positions, and they do not predict market direction.
More from the blog
- Strategy Backtesting on Unfluke
Backtest trading strategies on real Indian market data with Unfluke. Test equity, Nifty, Bank Nifty and options strategies with realistic costs and key metrics.
- Live Market Scanners
Explore Unfluke's real-time stock scanner for NSE markets. Scan 1,800+ stocks with 40+ technical indicators, fundamental filters, F&O data and custom rules.
- Option Strategy Simulator
Build and simulate multi-leg options strategies with Unfluke. Visualize payoffs, Greeks, max profit and loss, and replay historical option data from 2023.