Market Terminal
FII DII Data Today: How to Read Institutional Flows
10 min read · Updated 2 Nov 2026
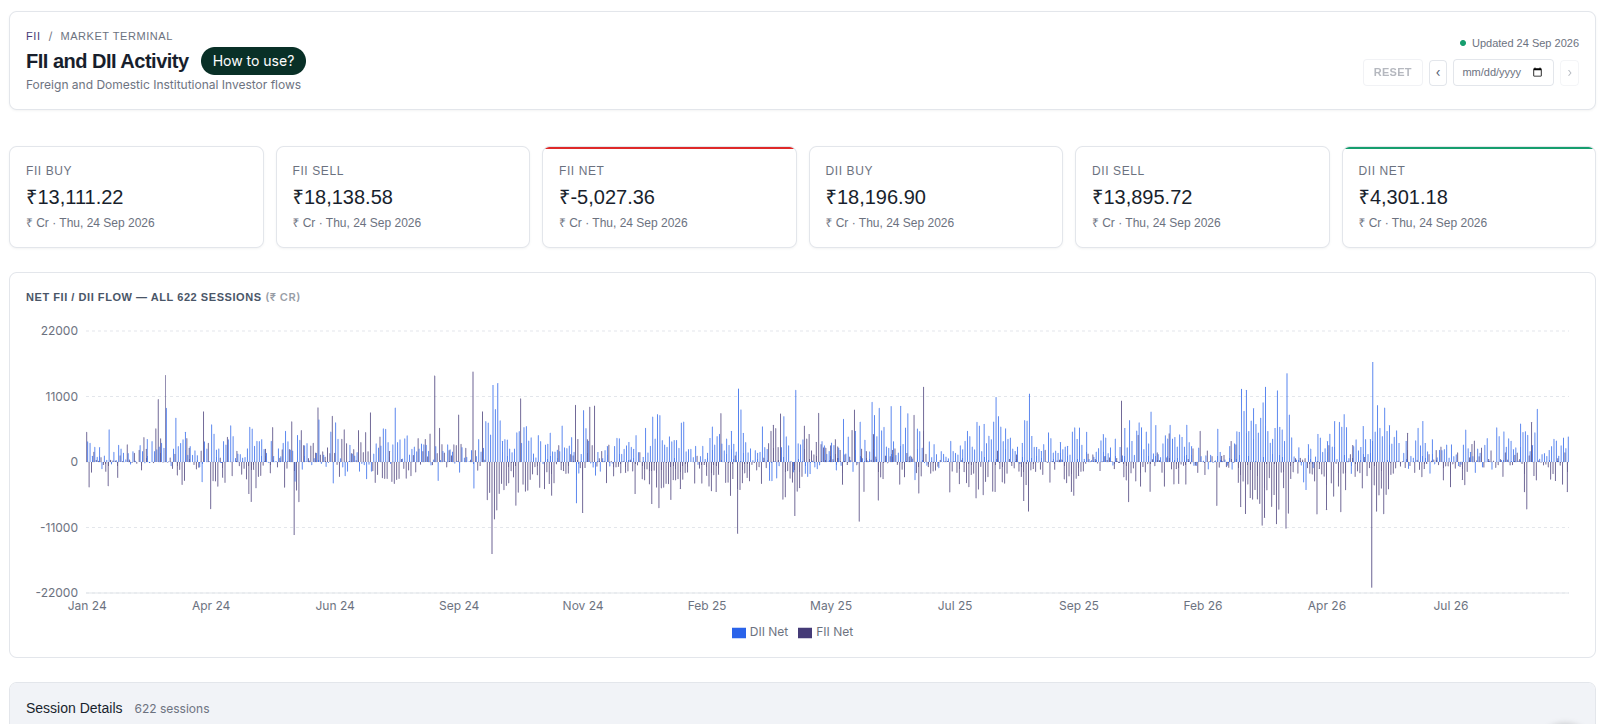
The FII/DII Activity page shows daily buy, sell and net flows of foreign and domestic institutional investors in ₹ crore, with more than two years of history in one chart.
This guide explains who FIIs and DIIs are, how to read the cards, chart and table, and how analysts interpret the two flows together.
What is FII and DII data?
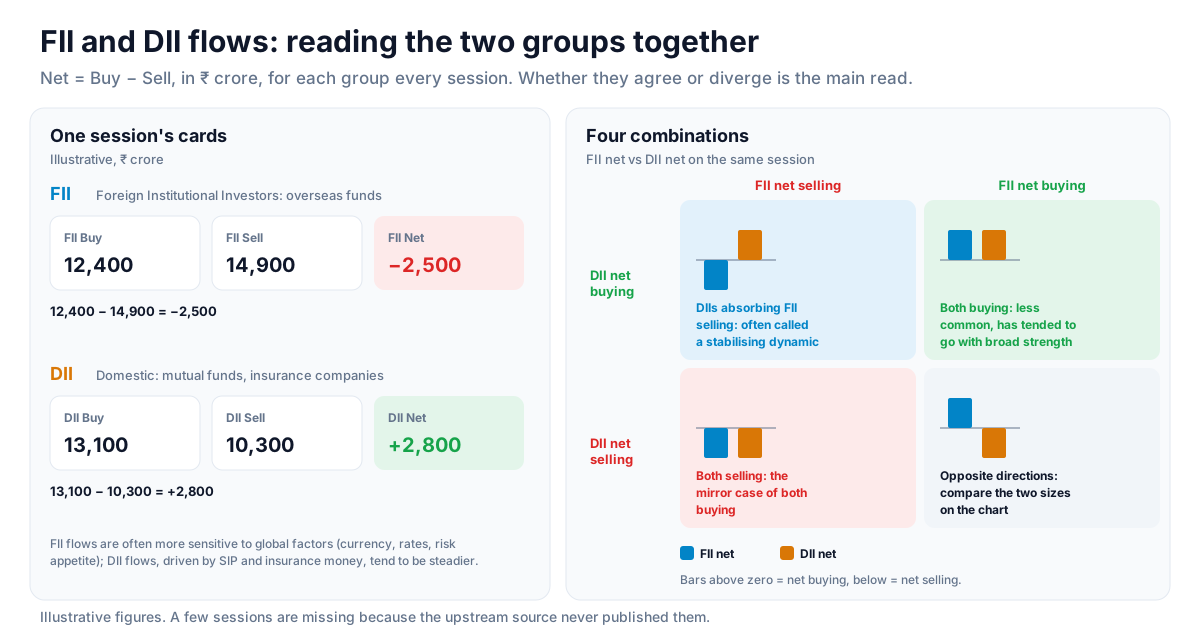
FIIs (Foreign Institutional Investors) are overseas funds investing in Indian markets. DIIs (Domestic Institutional Investors) are Indian institutions such as mutual funds and insurance companies. Each day, their total purchases and sales in the cash market are published, and the difference is their net flow.
The FII/DII page shows these figures for a selected session and for every session in its history. The date picker selects which session the cards describe.
How to read it
- Stat cards - FII Buy, FII Sell, FII Net, DII Buy, DII Sell and DII Net for the selected session, in ₹ crore.
- Net flow chart - FII net and DII net as bars for every session; bars above zero are net buying, below zero net selling. A marker shows the selected date.
- Session table - Date, FII Buy, FII Sell, FII Net, DII Buy, DII Sell and DII Net, newest first, 20 sessions per page.
- Net - Buy minus Sell; positive means the group bought more than it sold that day.
- Missing dates - a small number of sessions have no data because the upstream source never published them; those days are simply absent.
Reading the chart and cards together
Read the chart before the cards. A single day's number is noisy; the chart shows whether that day belongs to a run of buying or selling or stands out against it. Then compare the FII and DII bars on the same days - whether they point the same way or in opposite directions is the main thing analysts look at.
Concept: FII-DII divergence
FII flows are often seen as more sensitive to global factors such as currency moves, interest rates and risk appetite, while DII flows - driven largely by mutual fund SIP inflows and insurance money - tend to be steadier. When FIIs are net sellers and DIIs are net buyers in size, domestic demand is absorbing foreign selling, which market commentators have often described as a stabilising dynamic.
When FIIs and DIIs agree
Sessions where both groups are net buyers are less common and have tended to coincide with broad market strength - the Indices page for the same day shows whether that strength was broad. Both groups net selling together is the mirror case. Because the data is market-wide, the heatmap and bulk deal data help show where the money actually went.
Strategy ideas (ideas, not promises)
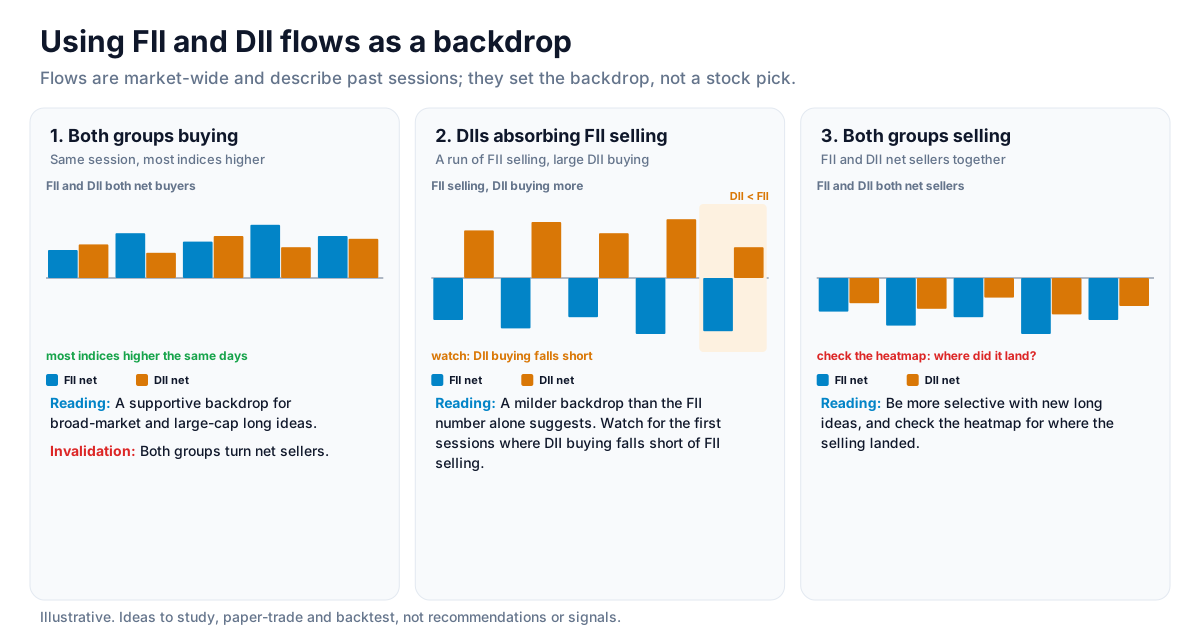
These are ideas to study, paper-trade and backtest, not recommendations or signals, and not a promise of any result. Institutional flows describe past sessions and are market-wide; they do not point to any single stock. Size, entries, exits and risk are your own decisions.
1. Both groups buying
- Setup: FII and DII net buyers on the same session, with most indices higher.
- Reading: A supportive backdrop for broad-market and large-cap long ideas.
- Invalidation: Both groups turning net sellers.
2. DIIs absorbing FII selling
- Setup: A run of FII net selling met by large DII net buying.
- Reading: A milder backdrop than the FII number alone suggests; watch for the first sessions where DII buying falls short of FII selling.
3. Both groups selling
- Setup: FII and DII net sellers together.
- Reading: Be more selective with new long ideas and check the heatmap for where the selling landed.
How to test these
Use the session table's history to mark past periods of each kind, then compare how Nifty 50 moved over the following weeks on the Indices page.
Where to go next
Read what multi-day FII streaks are next, or return to the equity data guide. Explore FII/DII history free.
How to Read This Data
FII and DII data shows the net buying or selling of foreign and domestic institutional investors each day. Analysts study it to understand broad institutional participation; a single day is often noisy, so the pattern over several sessions is usually more informative.
- Look at net flows over several consecutive sessions rather than one day's number.
- Compare FII and DII flows; they often move in opposite directions.
- Compare the flow pattern with the index over the same period.
- Note the scale of a day's flow against its usual range before calling it unusual.
Limitations: These are aggregate, provisional figures. They do not show individual participants, intentions or derivatives positions, and they do not predict market direction.
More from the blog
- Strategy Backtesting on Unfluke
Backtest trading strategies on real Indian market data with Unfluke. Test equity, Nifty, Bank Nifty and options strategies with realistic costs and key metrics.
- Live Market Scanners
Explore Unfluke's real-time stock scanner for NSE markets. Scan 1,800+ stocks with 40+ technical indicators, fundamental filters, F&O data and custom rules.
- Option Strategy Simulator
Build and simulate multi-leg options strategies with Unfluke. Visualize payoffs, Greeks, max profit and loss, and replay historical option data from 2023.