Product
Historical Charts - Clean Data From 2023
10 min read · Updated 2 Nov 2026
A trading chart is a memory of every price the market has agreed on. The deeper the chart goes, the more cycles you've seen, and the better your sense of what "normal" actually looks like. Retail traders who learn their craft on 2-year charts are systematically surprised by 5-year-cycle events. Traders who watched 15+ years aren't.
Unfluke's historical charts cover NSE equities with split-adjusted data since 2023, indices also from 2023, full option chain depth from 2023 onwards, and the F&O universe from 2023. Built on the TradingView library you already know, with bias-correction, backtest-trade overlays, and tier-gated depth based on your plan. This piece is a tour.
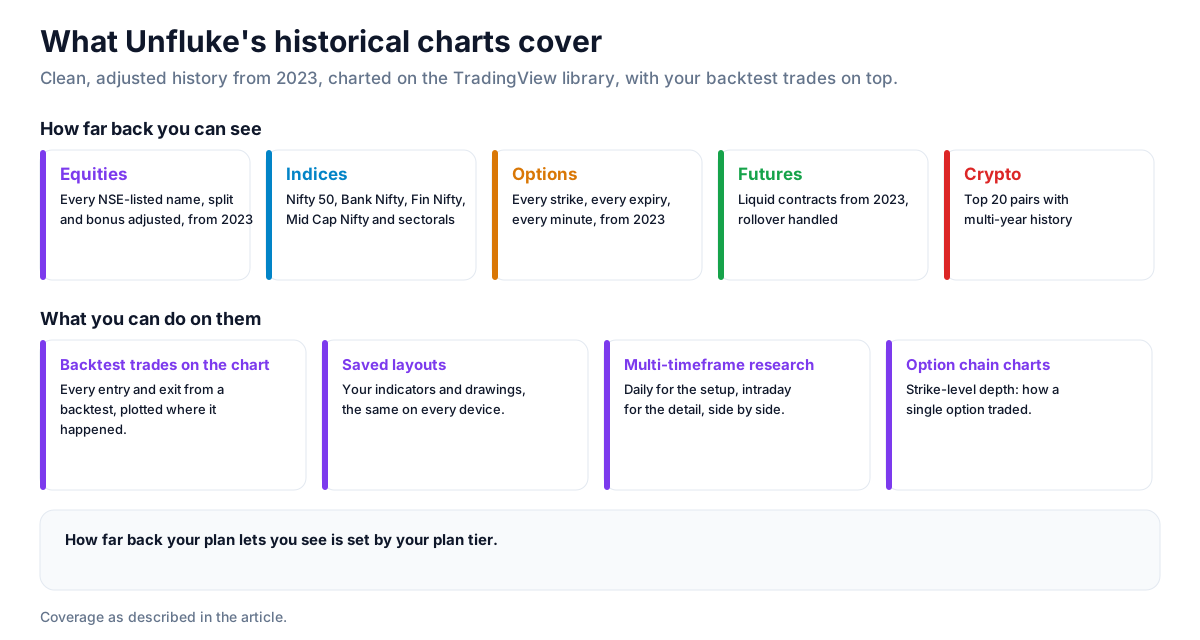
How far back you can see
- Equities: split-adjusted, bonus-adjusted data from 2023 on every NSE listed name
- Indices: from 2023 on Nifty 50, Bank Nifty, Fin Nifty, Mid Cap Nifty plus sectoral indices
- Options: full strike-level chain depth from 2023 onwards - every strike, every expiry, every minute
- Futures: from 2023 across all liquid contracts, rollover-handled
- Crypto: top 20 pairs (BTC, ETH, SOL, XRP, ADA, DOGE, MATIC and more) with multi-year history
- Intraday timeframes: 1-min candles for 10+ years on indices and liquid F&O names
Bias-corrected data - why this is non-obvious
"Historical price data" sounds simple but is full of traps. Splits and bonuses retro-actively change the price series - if you don't adjust, your chart shows fake gaps and your backtest sees fake stop-loss hits. Symbol changes (a company rebrands or merges) create discontinuities. Survivorship (delisted names disappearing) biases your sample. Unfluke handles all of these invisibly: split/bonus adjustments are pre-applied, symbol history is unified, and where survivorship matters (single-name studies), the data layer flags it. The result: the chart you see is what a trader could actually have experienced in real time.
Built on the TradingView library
We didn't reinvent charting. Unfluke charts use the TradingView Charting Library - the same engine you know from tradingview.com - which means: 100+ built-in indicators, full drawing toolset (Fibonacci, trendlines, channels, Gann, Elliott), multi-timeframe analysis, saved layouts, and keyboard-shortcut velocity you don't have to relearn. We layer on top: bias-corrected NSE data, F&O chain integration, and backtest overlays.
Backtest trades plotted on the chart
Run a strategy in the backtester, then open the Strategy Charts view to see every trade plotted on the underlying price. Entry markers, exit markers, stop-loss hits, target fills - all on the candles you've been staring at. This single feature changes how you understand a backtest: numbers tell you the P&L; the chart tells you where the strategy worked and where it bled. Most traders only spot their strategy's weaknesses once they see them on the chart.
Saved layouts - your setup, everywhere
Your chart setup - indicators, drawings, timeframes - saves automatically to your account. Open the same setup on a phone, another browser, or a fresh login and it's exactly as you left it. For traders who maintain a watchlist with custom layouts per name (different indicators for index vs single-stock vs crypto), this removes the friction of rebuilding charts every time.
Multi-timeframe research
The serious-trader workflow is: see the weekly to understand the regime, the daily for the swing setup, the hourly for the entry trigger, the 5-min for execution. Unfluke charts support this natively with side-by-side timeframe views and multi-timeframe-aware indicator overlays. Layouts save the timeframe configuration per chart.
Option chain charts - strike-level depth
Beyond underlying price, the chart engine renders option-chain specific views: ATM premium history, IV percentile over time, open-interest build-up by strike, max pain trajectory across an expiry cycle. Useful for options traders who need to see historical context before sizing into a position - especially on event-driven days.
What people use the historical charts for
- Thesis research - how did this stock behave during the 2020 crash, the 2022 banking shock, the 2018 NBFC crisis?
- Backtest validation - see exactly where the strategy worked and where it broke
- Regime analysis - what was IV percentile doing in similar setups historically?
- Education - learning chart patterns on real data since 2023 beats reading textbook examples
- Trade journal context - annotate why you took specific trades; the chart history persists with the annotation
Plan tiers and historical depth
Free tier includes full charting on the last 3 months of data; paid tiers raise the depth of historical data - from 2026 on Advanced and from 2023 on Pro. See pricing for tier-specific quotas. Plan choice depends on your style: positional investors rarely need 1-min options data; intraday options traders need it constantly.
Strategy ideas (ideas, not promises)
These are ideas to study, paper-trade and backtest, not recommendations or signals, and not a promise of any result. A chart shows what happened; past behaviour does not repeat on schedule. Size, entries, exits and risk are your own decisions.
1. Study how a stock behaved in a past shock
- Setup: pick a stressful period in the data and look at how far the stock fell and how long it took to recover.
- Use: a sense of the drawdowns a position in it might face.
2. Read your backtest on the candles
- Setup: after a backtest, open Strategy Charts to see every entry and exit on the price chart.
- Reading: look for the market conditions where the strategy bled; that is where a filter may help.
3. Line up two timeframes
- Setup: mark a level on the daily chart, then watch how price behaves around it on an intraday chart.
- Use: a clearer picture of whether a daily level matters intraday.
4. Keep a chart journal
- Setup: annotate why you took each trade on its chart.
- Use: reviewing the notes later shows which reasons held up.
How to test these
Turn what you see on the chart into a precise rule and backtest it on Unfluke before relying on it.
Honest caveats
Historical charts are perfect for what they are: a record of the past. They are not crystal balls. Pattern repetition is real but probabilistic, not deterministic. A chart pattern that worked 8 out of 10 times historically might not work the next time - that's how probabilistic systems behave. Use historical charts to build context, understand regimes, and validate backtests. Don't use them to trade based on visual pattern-matching alone.
Where to go next
Charts are the foundation; pair them with backtesting, scanning, and fundamental analysis for the full retail research stack. Sign up free to open your first chart in 30 seconds.
More from the blog
- Strategy Backtesting on Unfluke
Backtest trading strategies on real Indian market data with Unfluke. Test equity, Nifty, Bank Nifty and options strategies with realistic costs and key metrics.
- Live Market Scanners
Explore Unfluke's real-time stock scanner for NSE markets. Scan 1,800+ stocks with 40+ technical indicators, fundamental filters, F&O data and custom rules.
- Option Strategy Simulator
Build and simulate multi-leg options strategies with Unfluke. Visualize payoffs, Greeks, max profit and loss, and replay historical option data from 2023.