Market Terminal
Comparing Sector Index Valuations: How to Read Relative Value
8 min read · Updated 2 Nov 2026
The broad market's P/E can look reasonable while individual segments sit at very different points in their own valuation cycle. Unfluke's Index History page covers Nifty IT, Nifty Bank, Nifty Next 50, Nifty Midcap 100, Nifty Smallcap 100 and Nifty 500 alongside Nifty 50, which makes side-by-side comparison straightforward.
Why segments move through valuation cycles differently
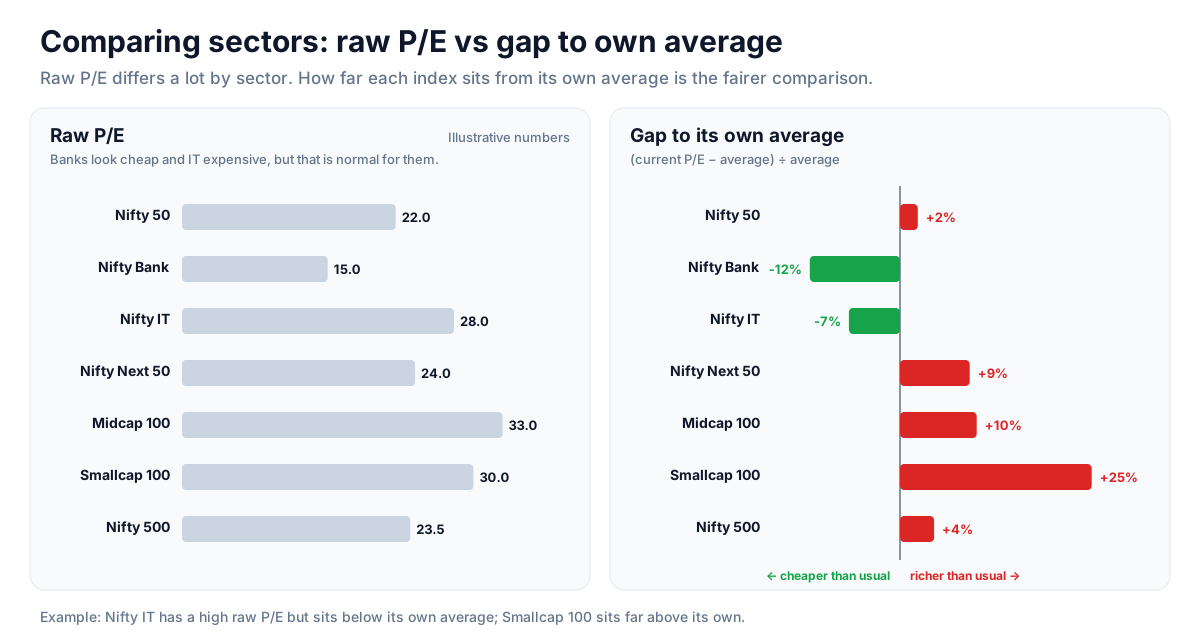
Rate-sensitive banks, growth-oriented IT and the broader small and midcap indices respond to different drivers. One can look expensive relative to its own history while another looks cheap, even when Nifty 50 appears fairly valued. Looking only at the headline index misses this.
Building a simple comparison
Switch between indices and note how far each one's current P/E and P/B sit from its own average - the valuation cards show this gap directly. A short table of those gaps shows which segments are richer or cheaper relative to their own normal range, which is a fairer comparison than raw P/E numbers across very different sectors.
Valuation together with relative strength
Valuation describes price relative to fundamentals; momentum describes what price is doing now. Analysts often look at both together - for example, whether a segment that screens cheap is also starting to rise on the relative strength ranking. Cheap valuation on its own can persist for a long time.
Reading an expensive segment
A segment trading well above its own average valuation while its relative strength fades combines two cautionary readings. That combination is often discussed as a sign of elevated risk for the segment, though it does not say when or whether prices will adjust.
Strategy ideas (ideas, not promises)
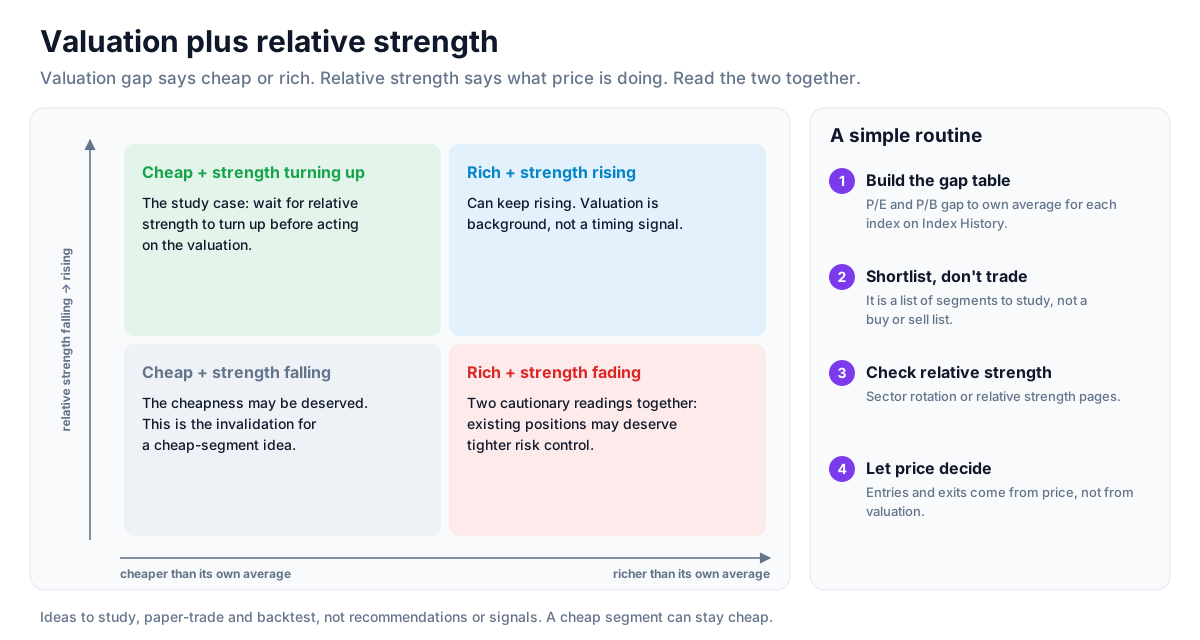
These are ideas to study, paper-trade and backtest, not recommendations or signals, and not a promise of any result. A cheap segment can stay cheap, and an expensive one can keep rising. Size, entries, exits and risk are your own decisions.
1. Rank segments against their own history
- Setup: note how far each index's P/E and P/B sit from its own average on Index History.
- Reading: a short table of those gaps shows which segments are rich or cheap relative to their normal range, a fairer comparison than raw P/E.
- Use: a starting list of segments to study, not a buy or sell list.
2. Look for cheap plus improving strength
- Setup: a segment well below its average valuation.
- Entry idea: wait for its relative strength to turn up on the sector rotation or relative strength pages before acting on the valuation.
- Invalidation: if relative strength keeps falling, the cheapness may be deserved.
3. Treat rich plus fading strength as a caution
- Setup: a segment well above its average valuation while its relative strength declines.
- Reading: two cautionary readings together; existing positions there may deserve tighter risk control.
How to test these
At past dates, build the valuation-gap table across the indices, then check each segment's return over the following months. See whether cheap-and-improving or rich-and-fading segments behaved differently from the rest.
Where to go next
Return to the Nifty PE ratio guide or the reference data guide. Compare index valuations free.
How to Read This Data
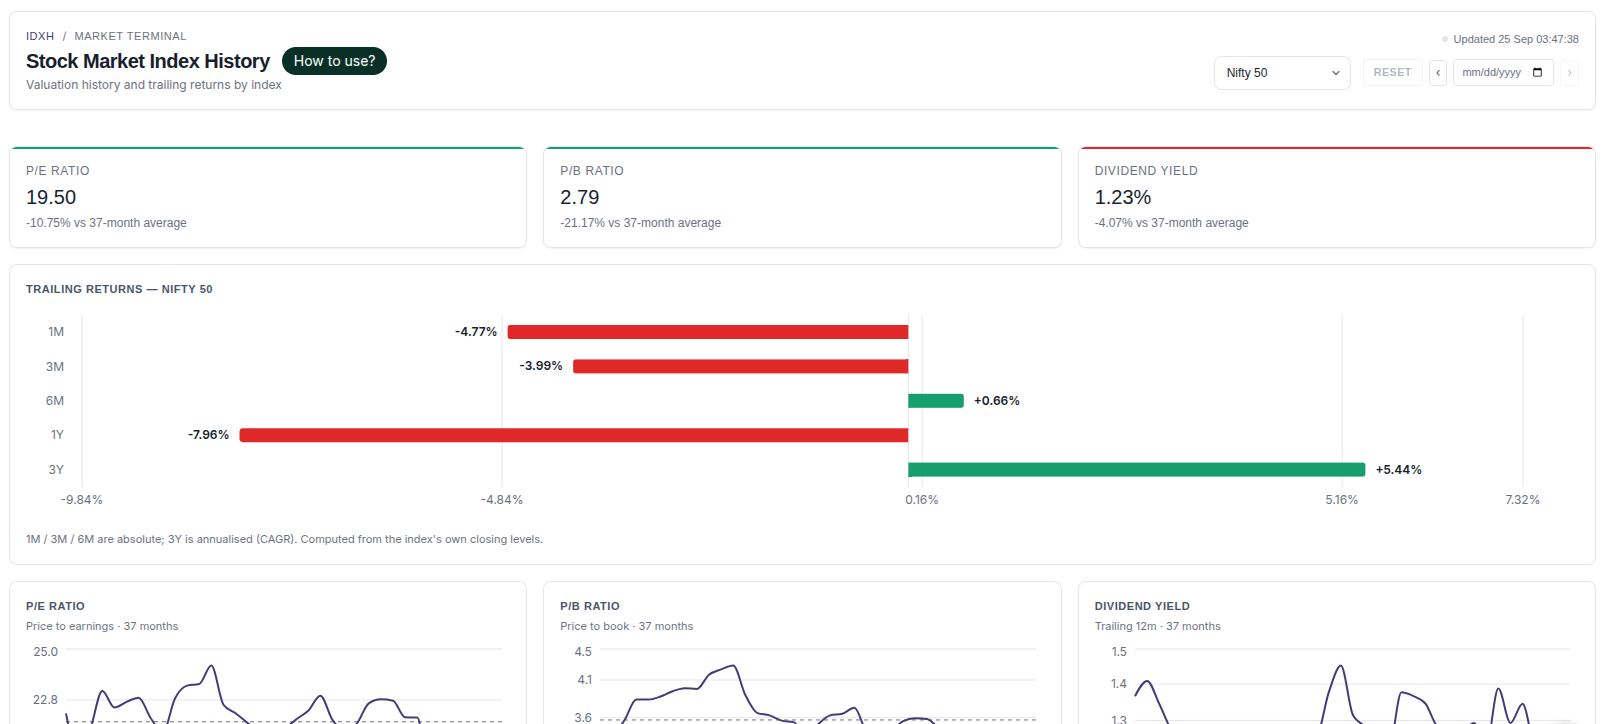
Index history shows long-term index levels together with valuation measures such as P/E, P/B and dividend yield. It helps put the current level in historical context, for example comparing today's P/E with the index's own long-term range.
- Compare the current P/E or P/B with the index's own historical range.
- Look at past drawdowns and how long recoveries took.
- Compare trailing returns over different periods (1, 3, 5 years) to see how results depend on the start date.
- Compare broad and sector indices, keeping in mind that their typical valuations differ.
Limitations: Historical valuations and returns do not predict future returns. Index methodology and composition change over time, which affects long-term comparisons.
More from the blog
- Strategy Backtesting on Unfluke
Backtest trading strategies on real Indian market data with Unfluke. Test equity, Nifty, Bank Nifty and options strategies with realistic costs and key metrics.
- Live Market Scanners
Explore Unfluke's real-time stock scanner for NSE markets. Scan 1,800+ stocks with 40+ technical indicators, fundamental filters, F&O data and custom rules.
- Option Strategy Simulator
Build and simulate multi-leg options strategies with Unfluke. Visualize payoffs, Greeks, max profit and loss, and replay historical option data from 2023.