Market Terminal
Index Reconstitution and Rebalancing Explained
7 min read · Updated 2 Nov 2026
When a stock is added to or removed from a major index, funds that track the index have to buy or sell it, which can create unusual flows around the effective date. Unfluke's Index Constituents page captures membership daily, so changes can be seen as they happen.
Spotting a membership change
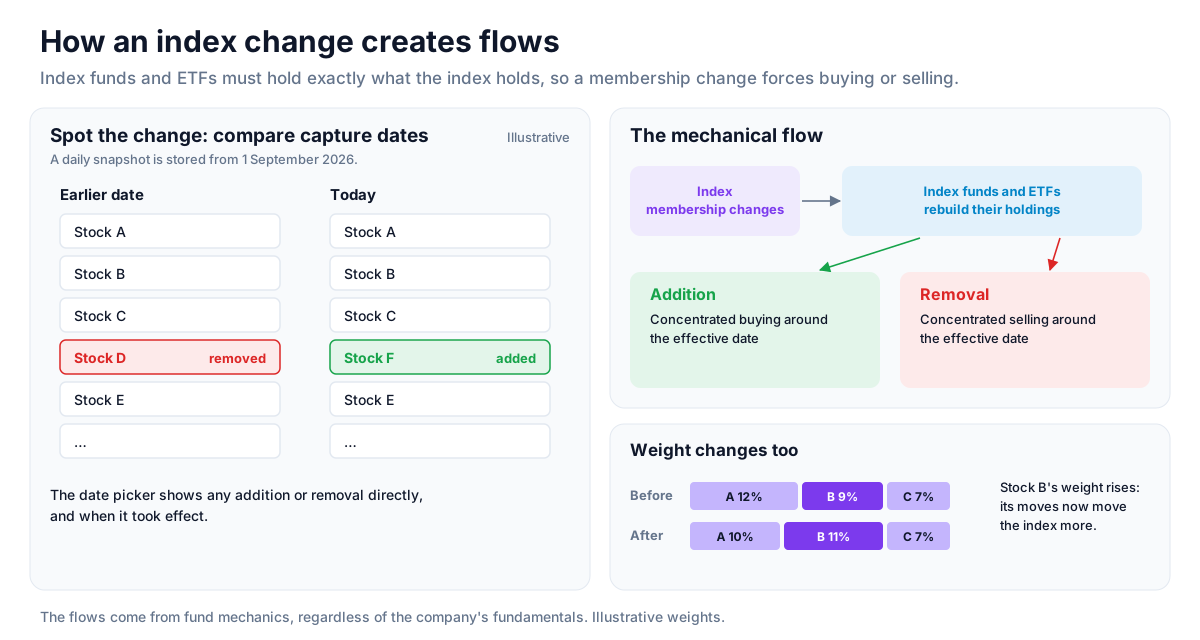
Because a snapshot is stored every day (from 1 September 2026), comparing today's list with an earlier date using the date picker shows any addition or removal directly, and when it took effect.
Why index changes create flows
Index funds and ETFs aim to hold exactly what the index holds. An addition therefore brings concentrated buying from those funds around the effective date, and a removal brings selling - regardless of the company's fundamentals. Volume around that window, visible on the Movers page's Volume Gainers tab, often reflects this.
Weight changes without additions or removals
Rebalancing also adjusts how much each existing member counts in the index. A member with a larger weight moves the index more, which is why the Heatmap sizes tiles by index weight.
Rebalancing and breadth together
A reconstitution that coincides with weak market breadth can add volatility around the effective date, since mechanical fund flows meet an already fragile market.
Strategy ideas (ideas, not promises)
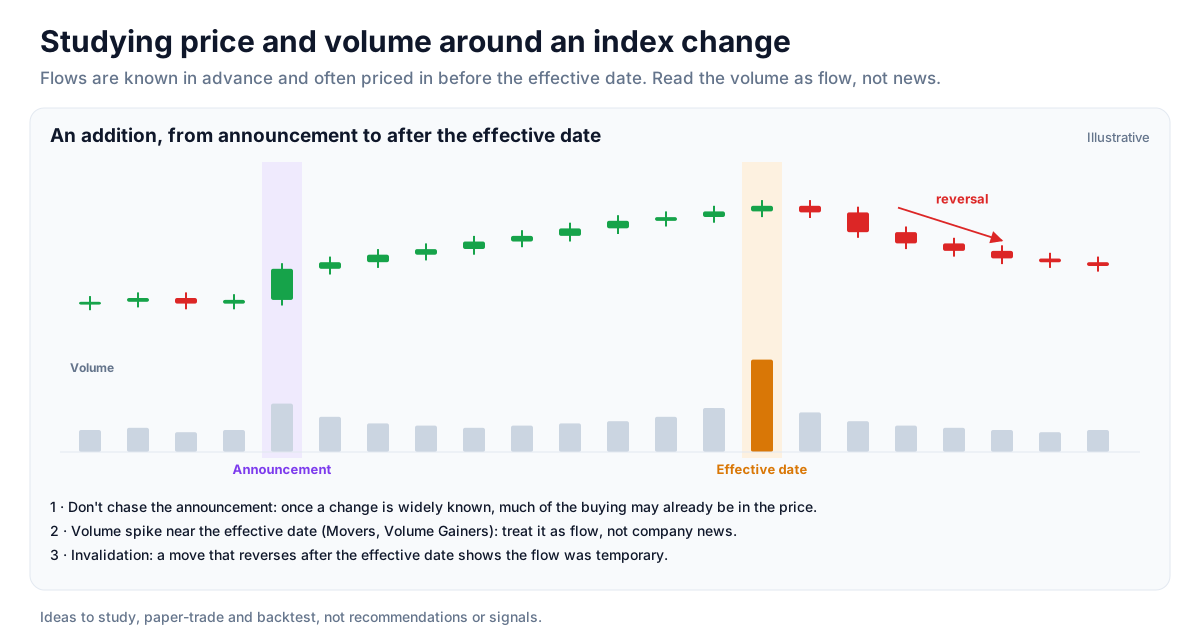
These are ideas to study, paper-trade and backtest, not recommendations or signals, and not a promise of any result. Index flows are well known in advance and are often priced in before the effective date. Size, entries, exits and risk are your own decisions.
1. Watch volume around the effective date
- Setup: an addition or removal spotted by comparing capture dates on Index Constituents.
- Reading: index funds buy additions and sell removals around the effective date; the Volume Gainers tab on the Movers page often shows it.
- Use: treat unusual price and volume around that window as flow, not news about the company.
2. Do not chase the announcement
- Reading: once a change is widely known, much of the expected buying or selling may already be in the price.
- Invalidation: a move that reverses after the effective date shows the flow was temporary.
3. Remember the weight change too
- Reading: a member whose weight rises moves the index more; its moves matter more to index-level ideas from then on.
How to test these
For changes captured on Index Constituents, check the stock's price and volume on the Historical Charts in the weeks before and after the effective date, and how much of any move held afterwards.
Where to go next
Return to the market breadth guide or the reference data guide. Try Index Constituents free.
How to Read This Data
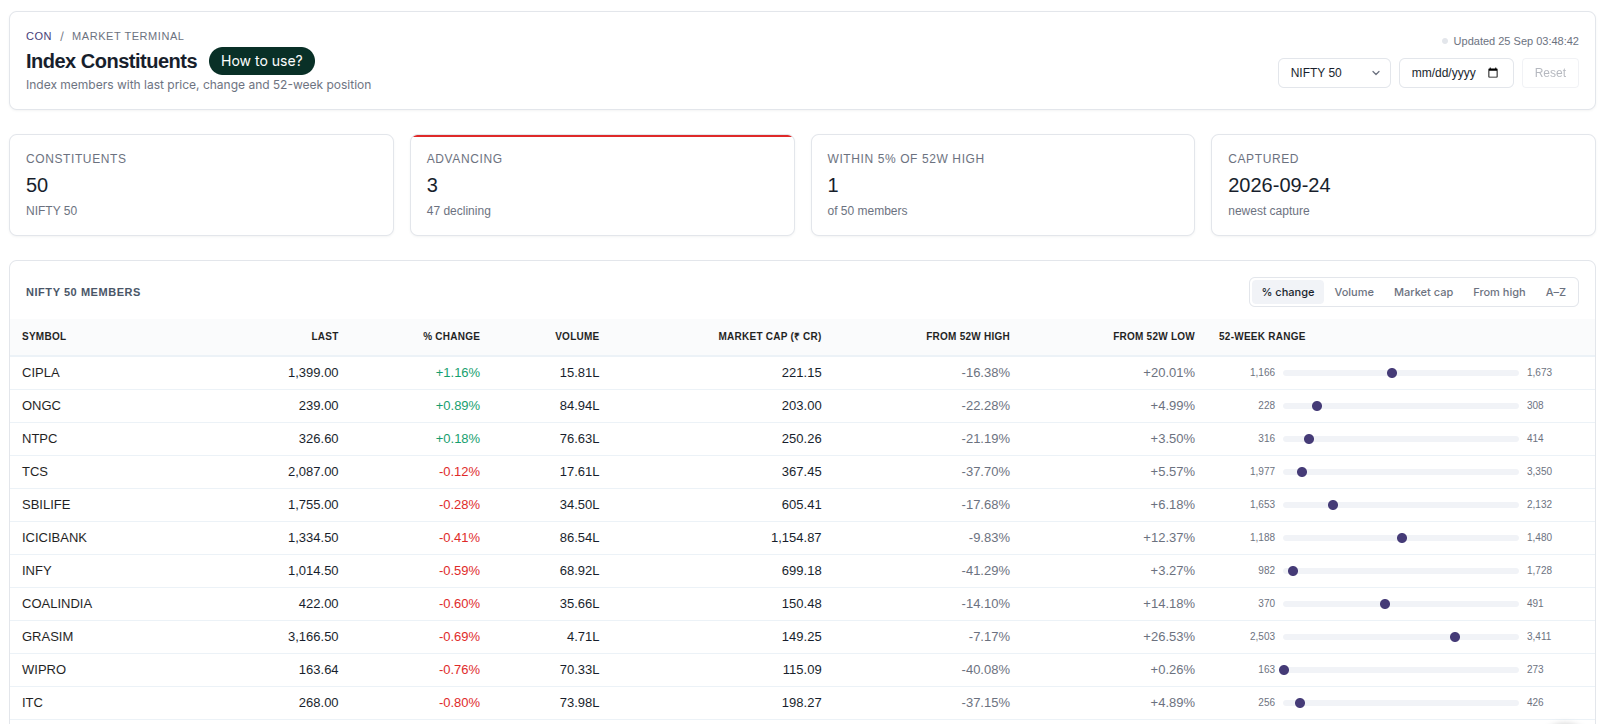
Constituent data lists the stocks in an index with their weights. It shows what drives the index: in many indices a handful of large companies account for a big share of the total weight.
- Look at the largest weights to see how concentrated the index is.
- Add up sector weights to see which sectors dominate the index.
- Compare members' 52-week positions to gauge breadth within the index.
- Use the monthly history to see how weights and membership have changed.
Limitations: Index composition and weights change at rebalancing. A weight shown here is a point-in-time figure.
More from the blog
- Strategy Backtesting on Unfluke
Backtest trading strategies on real Indian market data with Unfluke. Test equity, Nifty, Bank Nifty and options strategies with realistic costs and key metrics.
- Live Market Scanners
Explore Unfluke's real-time stock scanner for NSE markets. Scan 1,800+ stocks with 40+ technical indicators, fundamental filters, F&O data and custom rules.
- Option Strategy Simulator
Build and simulate multi-leg options strategies with Unfluke. Visualize payoffs, Greeks, max profit and loss, and replay historical option data from 2023.