Market Terminal
Nifty 50 Constituents and Market Breadth: How to Read Them
9 min read · Updated 2 Nov 2026
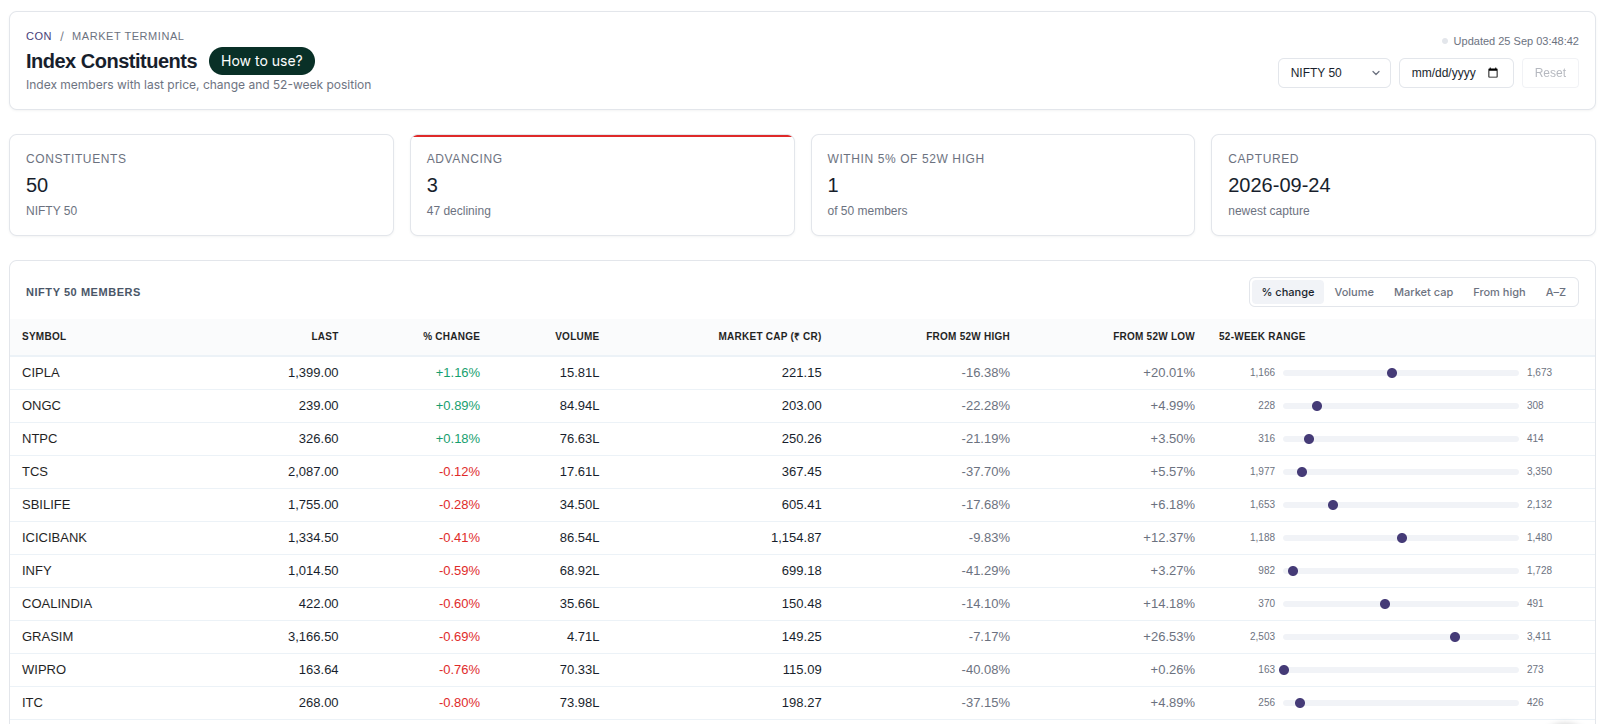
Index Constituents lists every member of Nifty 50, Nifty Bank or Nifty Next 50 with its last price, change, volume and position in its 52-week range, plus breadth stats for the index as a whole.
This guide explains each part of the page and how breadth helps describe what is happening beneath the index level.
What is market breadth?
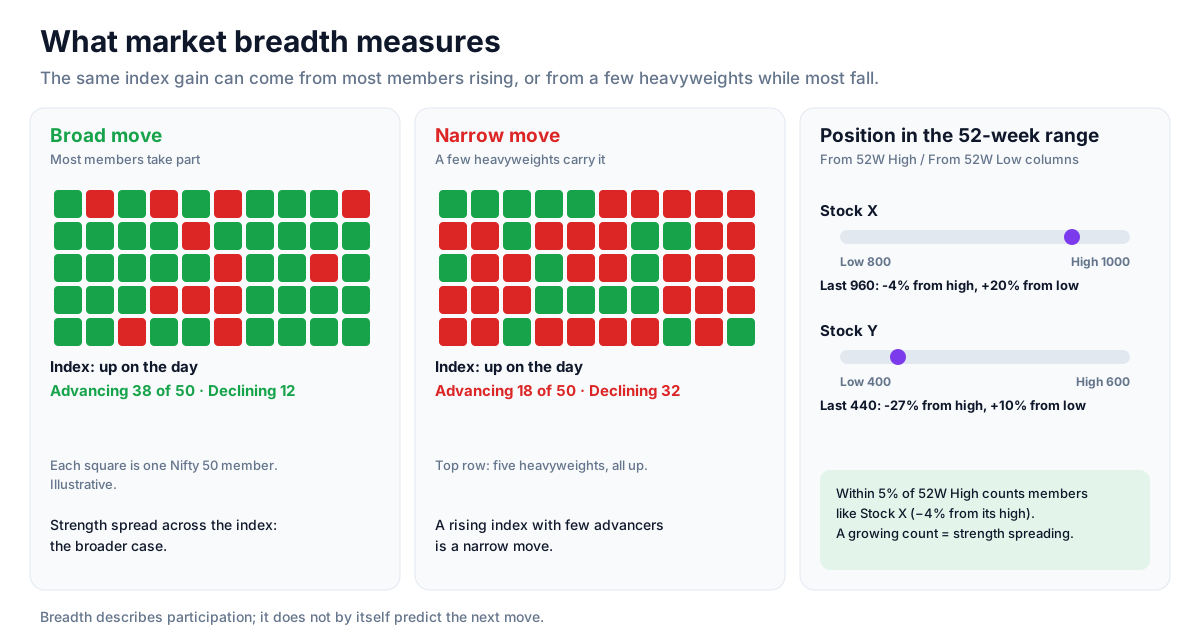
Breadth measures how many stocks are taking part in a move. An index can rise because most members rise, or because a few large members rise while most fall. Counting advancing members, or members close to their 52-week high, separates those two cases. The page captures index membership daily from 1 September 2026, so a past date shows who was in the index then.
How to read it
- Index buttons and date picker - choose Nifty 50, Nifty Bank or Nifty Next 50, and optionally a past capture date.
- Constituents - number of members; Advancing - members up on the day, with the declining count; Within 5% of 52W High - members trading close to their 52-week high; Captured - the date of the membership snapshot.
- Last and % Change - latest price and the day's move.
- Volume - shares traded.
- Market cap - shown as close x volume in ₹ crore. It is a traded-value proxy, not true market capitalisation.
- From 52W High / From 52W Low - percentage distance from the 52-week extremes, with a range bar showing where the price sits.
- Sort - by % change, volume, market cap, distance from high, or A-Z. Click a row to open that stock's option chain.
Using the page for research
- Compare the index move with the Advancing count - a rising index with few advancers is a narrow move.
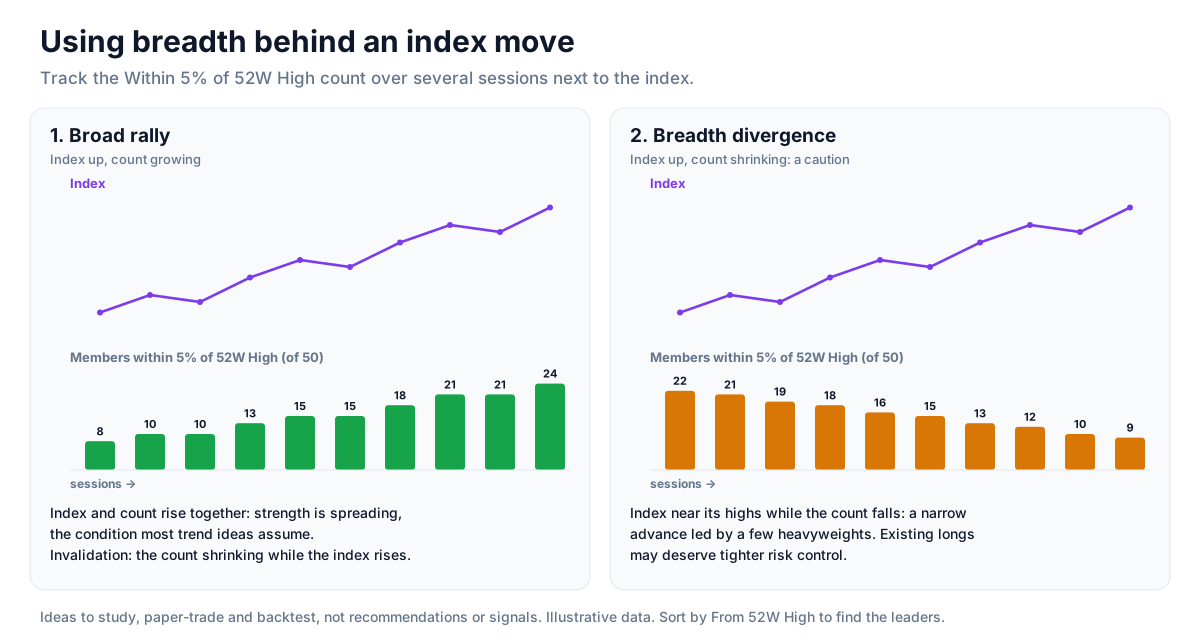
- Track the Within 5% of 52W High count over several sessions to see whether strength is broadening or narrowing.
- Sort by From 52W High to find the members nearest their highs.
- In a weak market, sort by From 52W Low to see which members are holding up best.
Breadth divergence
A widely discussed pattern is the index making new highs while breadth - advancers and members near their highs - declines over several sessions. Such a divergence has often been read as a sign of a fragile advance. Breadth readings describe participation; they do not by themselves predict the next move, so they are usually combined with other data such as the Heatmap.
Strategy ideas (ideas, not promises)
These are ideas to study, paper-trade and backtest, not recommendations or signals, and not a promise of any result. Breadth describes participation; it does not time the next move. Size, entries, exits and risk are your own decisions.
1. Prefer broad rallies
- Setup: the index rising with most members advancing and the Within 5% of 52W High count growing over several sessions.
- Reading: strength is spreading across the index, the condition most trend-following ideas assume.
- Invalidation: the count shrinking while the index still rises.
2. Treat a breadth divergence as a caution
- Setup: the index near its highs while advancers and members near their highs decline over several sessions.
- Reading: a narrow advance led by a few heavyweights; existing longs may deserve tighter risk control.
3. Find the leaders inside the index
- Setup: sort by From 52W High.
- Reading: members nearest their highs in a broad rally are the stronger names; in a weak market, sorting by From 52W Low shows which are holding up best.
How to test these
Note the Advancing and Within 5% of 52W High counts on past capture dates (available from 1 September 2026) and compare them with the index's move over the following weeks. Look for how often a shrinking count came before a weaker index.
Where to go next
Read index reconstitution and rebalancing and 52-week breakouts, or return to the reference data guide. Try Index Constituents free.
How to Read This Data
Constituent data lists the stocks in an index with their weights. It shows what drives the index: in many indices a handful of large companies account for a big share of the total weight.
- Look at the largest weights to see how concentrated the index is.
- Add up sector weights to see which sectors dominate the index.
- Compare members' 52-week positions to gauge breadth within the index.
- Use the monthly history to see how weights and membership have changed.
Limitations: Index composition and weights change at rebalancing. A weight shown here is a point-in-time figure.
More from the blog
- Strategy Backtesting on Unfluke
Backtest trading strategies on real Indian market data with Unfluke. Test equity, Nifty, Bank Nifty and options strategies with realistic costs and key metrics.
- Live Market Scanners
Explore Unfluke's real-time stock scanner for NSE markets. Scan 1,800+ stocks with 40+ technical indicators, fundamental filters, F&O data and custom rules.
- Option Strategy Simulator
Build and simulate multi-leg options strategies with Unfluke. Visualize payoffs, Greeks, max profit and loss, and replay historical option data from 2023.