Market Terminal
IPO Calendar and Listing Gains: How to Read Them
9 min read · Updated 2 Nov 2026
The IPO Calendar lists Mainboard and SME IPOs by stage - open now, upcoming, closed and recently listed - with issue dates, price band and, for listed issues, how the stock did on its first trading day.
This guide explains each tab and column, how the listing gain is calculated, and how the data can be used to study the primary market.
What is an IPO calendar?
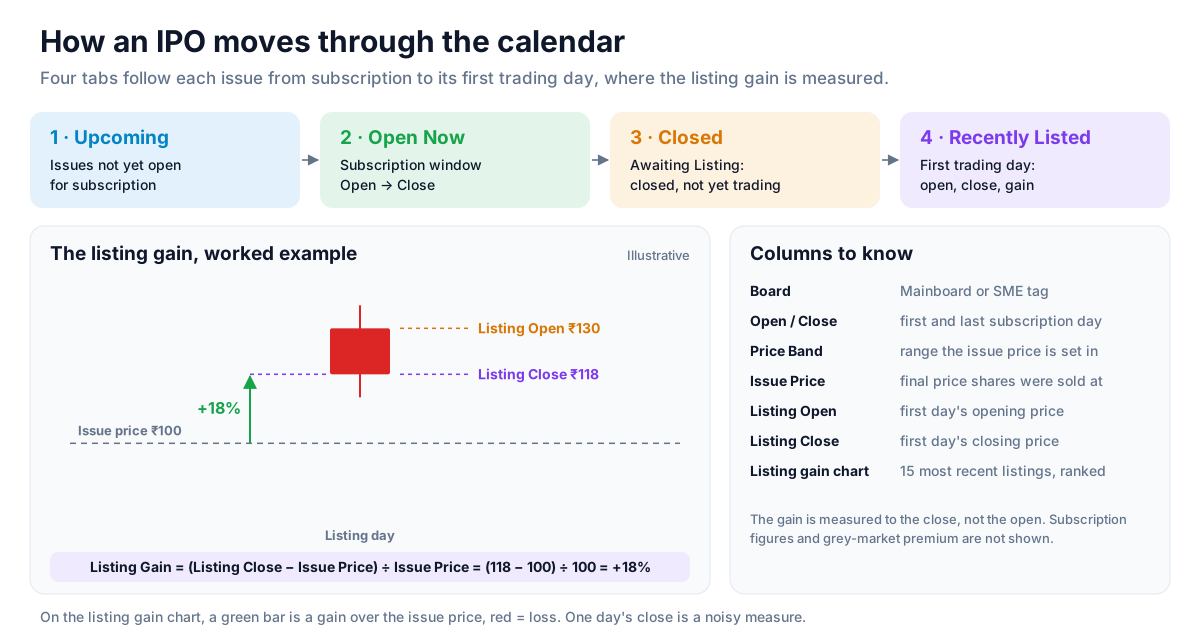
An IPO (initial public offering) is when a company first sells shares to the public. An IPO calendar tracks each issue through its life: the subscription window, the close, and the day the shares begin trading on the exchange.
On Unfluke the calendar is split into four tabs and shows both Mainboard issues and SME issues (the exchange platform for smaller companies). Subscription figures and grey-market premium are not shown, because the data source does not publish them.
How to read it
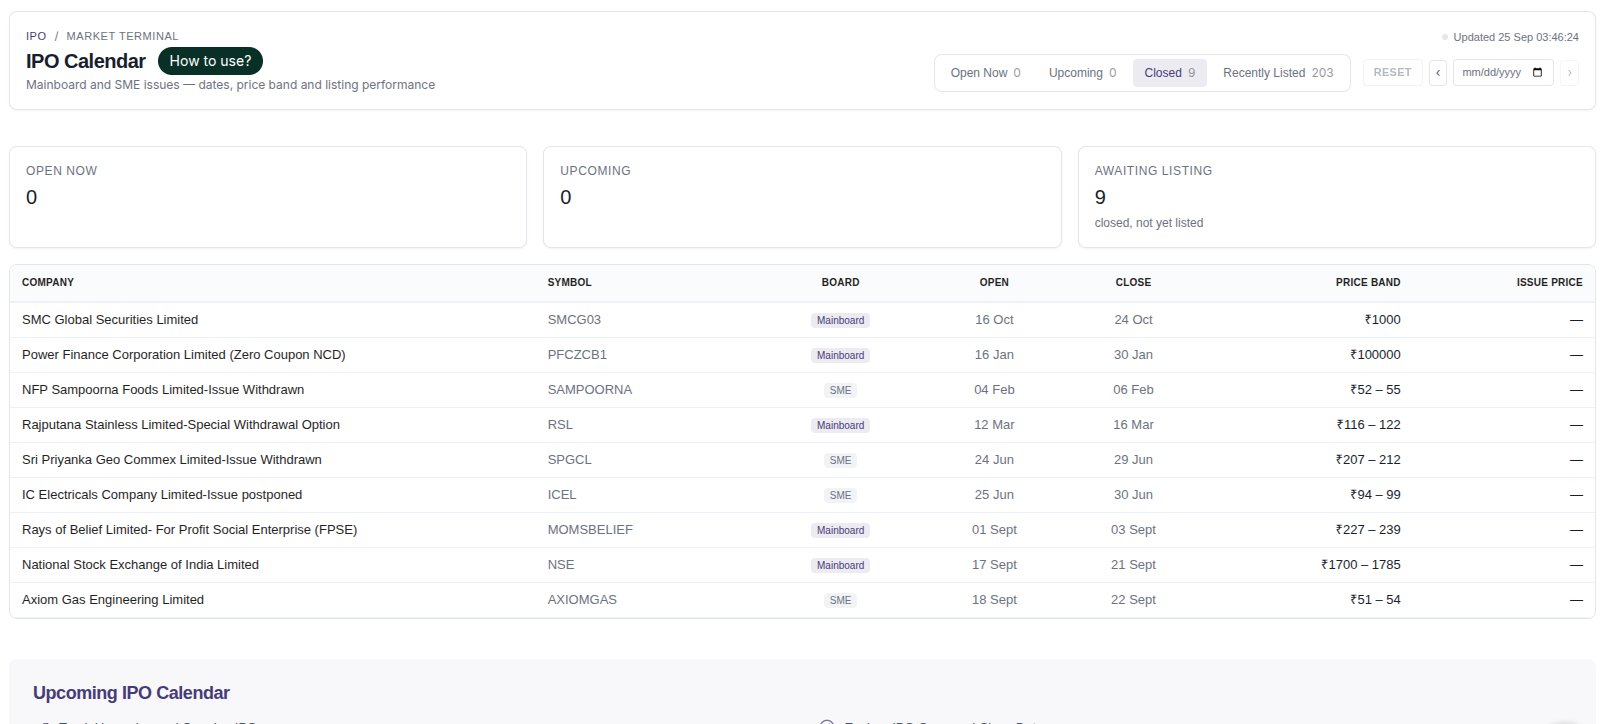
- Stat cards - counts of issues Open Now, Upcoming, and Awaiting Listing (closed but not yet trading).
- Tabs - Open Now, Upcoming, Closed and Recently Listed. Each tab shows the columns that apply to that stage.
- Company and Symbol - the issuer and its trading symbol.
- Board - a tag showing Mainboard or SME.
- Open / Close - the first and last day of the subscription window.
- Price Band - the range within which the issue price is set; Issue Price is the final price allotted shares were sold at.
- Listed, Listing Open, Listing Close (Recently Listed tab) - the listing date and the first day's opening and closing prices.
- Listing Gain - the percentage change from the issue price to the listing-day close: (listing close - issue price) / issue price. Green is a gain, red a loss.
- Listing gain chart - the 15 most recent listings ranked by listing gain, shown on the Recently Listed tab.
Using the page for research
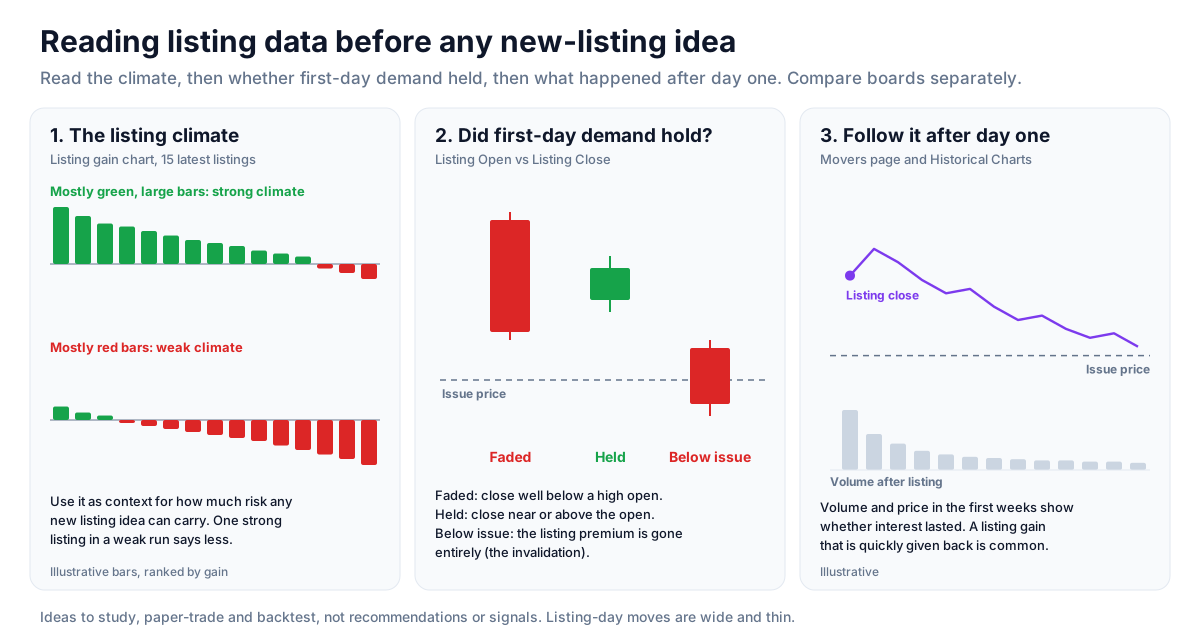
- Start on the Recently Listed tab and look at the chart as a whole - a run of mostly green bars and a run of mostly red bars describe very different primary-market conditions.
- Compare Listing Open with Listing Close for the same issue to see whether first-day demand held up through the session.
- Use the Board tag to separate Mainboard and SME results before drawing conclusions, since the two behave differently.
- Check the Upcoming and Open Now tabs to see which issues are in the pipeline and when their windows close.
Reading listing gains in context
Listing gains are often read as a gauge of primary-market sentiment. Many strong recent listings suggest demand is running ahead of supply broadly, not just for one popular issue; a string of weak listings suggests the opposite.
A single day's close is a noisy measure. First-day price discovery is wider and less liquid than for a stock with months of trading history, and the listing gain can reverse in the sessions that follow. For that reason the figure is best treated as context about the market rather than as a verdict on any one company.
Strategy ideas (ideas, not promises)
These are ideas to study, paper-trade and backtest, not recommendations or signals, and not a promise of any result. Listing-day moves are wide, thin and can reverse within sessions. Size, entries, exits and risk are your own decisions.
1. Read the listing climate before any single issue
- Setup: the listing gain chart on the Recently Listed tab, with the 15 most recent listings.
- Reading: mostly green, large bars describe a strong primary market; mostly red bars describe a weak one. A single strong listing in a weak run says less.
- Use: treat the climate as context for how much risk any new listing idea can carry.
2. Watch whether first-day demand held
- Setup: compare Listing Open with Listing Close for a recent issue.
- Reading: a close well below a high open shows demand faded during the session; a close near or above the open shows it held.
- Invalidation: a stock that closes its first day below the issue price has given up the listing premium entirely.
3. Separate the boards
- Setup: filter by the Board tag before drawing conclusions.
- Reading: SME listing gains are larger and more scattered; read Mainboard and SME results as two different samples.
4. Follow the stock after day one
- Setup: track a recent listing on the Movers page and the Historical Charts in the sessions after listing.
- Reading: volume and price in the first weeks show whether interest lasted; a listing gain that is quickly given back is common.
How to test these
Take listings from past months on the Recently Listed tab, note the listing gain and the open-to-close behaviour, then check where each stock traded a few weeks later. Compare Mainboard and SME results separately.
Where to go next
Read Mainboard vs SME IPOs next, or return to the reference data guide. Try the IPO Calendar free.
How to Read This Data
The IPO calendar lists open, upcoming and recently listed public issues with their price band, issue size, dates and listing performance. It is a reference for understanding the primary market and how new issues have behaved after listing.
- Separate mainboard issues from SME issues; they follow different rules and usually have different liquidity.
- Compare subscription levels across investor categories where available.
- Compare the listing price with the issue price to see each issue's listing gain or loss.
- Look at many past listings together instead of drawing conclusions from one issue.
Limitations: Past listing performance does not indicate how a future issue will list. New listings can be volatile and thinly traded in their first sessions.
More from the blog
- Strategy Backtesting on Unfluke
Backtest trading strategies on real Indian market data with Unfluke. Test equity, Nifty, Bank Nifty and options strategies with realistic costs and key metrics.
- Live Market Scanners
Explore Unfluke's real-time stock scanner for NSE markets. Scan 1,800+ stocks with 40+ technical indicators, fundamental filters, F&O data and custom rules.
- Option Strategy Simulator
Build and simulate multi-leg options strategies with Unfluke. Visualize payoffs, Greeks, max profit and loss, and replay historical option data from 2023.