Market Terminal
Mainboard vs SME IPOs: Understanding the Risk Difference
7 min read · Updated 2 Nov 2026
Not all IPOs carry the same risk profile. Unfluke's IPO Calendar tags every listing as Mainboard or SME (Small and Medium Enterprise), and that tag changes how the listing data should be read.
This article explains why.
The structural difference between the two boards
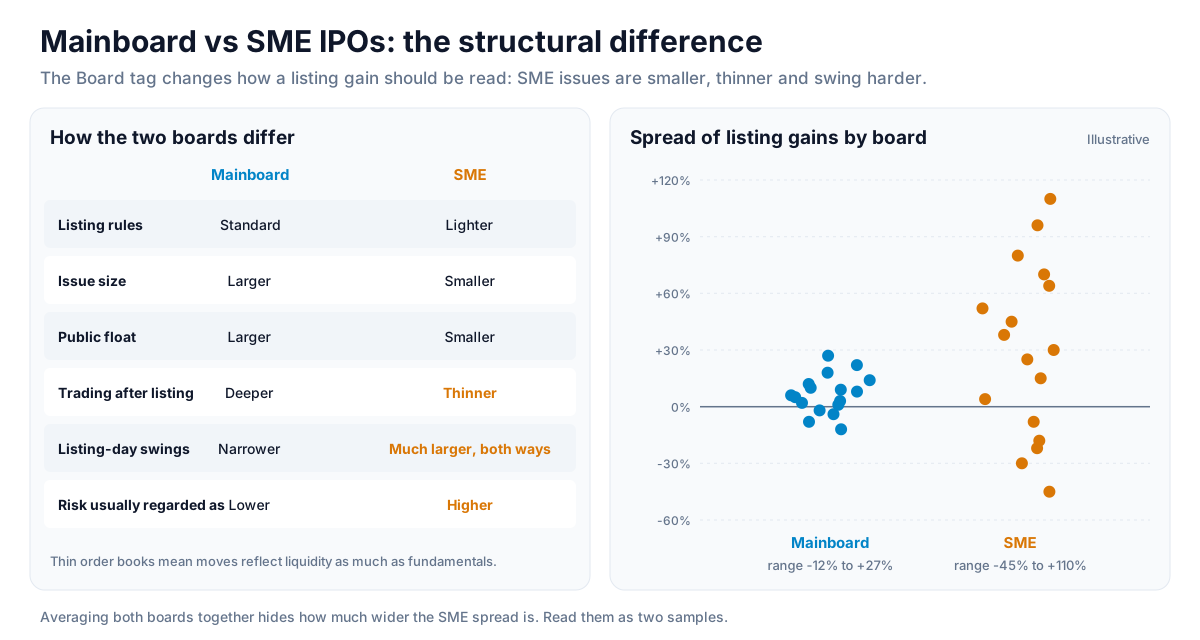
SME-board companies face lighter listing requirements and usually have smaller issue sizes, a smaller public float and thinner trading after listing. Because the order book is thinner, SME stocks can show much larger listing-day swings in both directions - moves that reflect liquidity as much as the company's fundamentals.
Compare listing gains by board, not pooled together
On the listing gain chart, SME and Mainboard names sit side by side. Averaging them together hides the fact that SME listing gains tend to be larger and more dispersed. A strong SME streak says less about broad market appetite than a strong Mainboard streak does, so it helps to read the two groups separately.
Liquidity - the part most often overlooked
A large listing-day gain on a thinly traded SME stock can be hard to realise in practice, because a sizeable order can move the price. Checking trading volume in the sessions after listing - for example on the Movers page - gives a more complete picture than the listing gain alone.
How investors typically frame the difference
Because outcomes are more widely spread and liquidity is thinner, SME issues are generally regarded as higher risk than Mainboard issues, regardless of how attractive a first-day gain looks. The Board tag is the quickest way to keep that distinction visible when studying the data.
Strategy ideas (ideas, not promises)
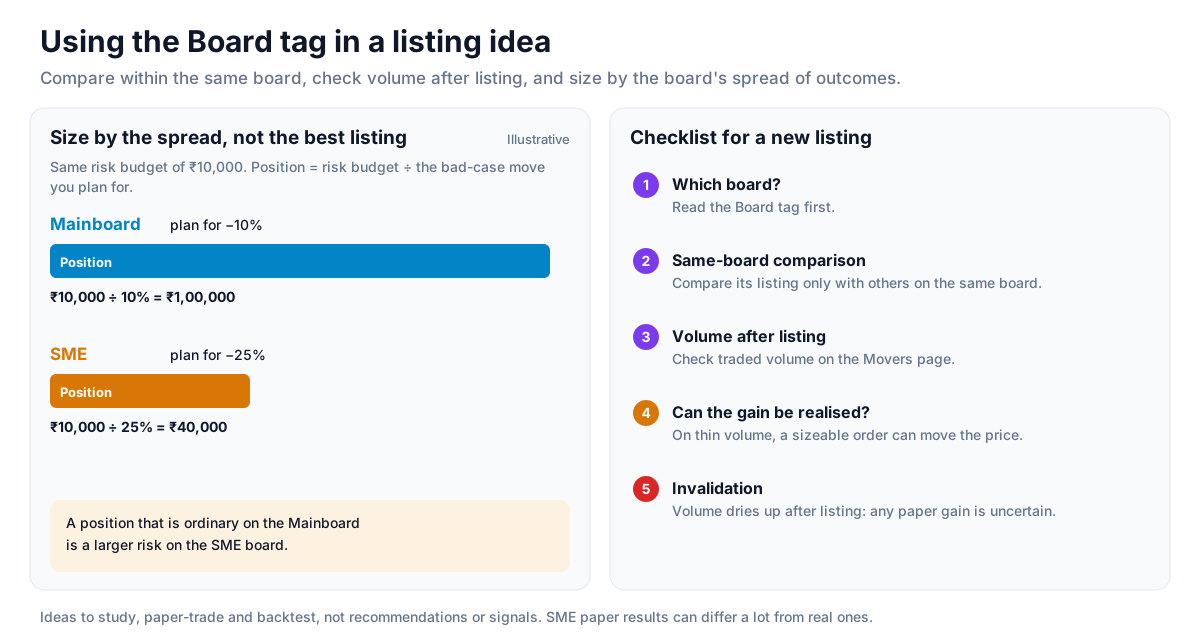
These are ideas to study, paper-trade and backtest, not recommendations or signals, and not a promise of any result. SME stocks can be hard to buy or sell in size, so paper results can differ a lot from real ones. Size, entries, exits and risk are your own decisions.
1. Keep separate expectations by board
- Setup: the Board tag on the IPO Calendar.
- Reading: a strong SME listing streak says less about broad market appetite than a strong Mainboard streak.
- Use: compare a new issue's listing only with others on the same board.
2. Check liquidity before the listing gain
- Setup: after listing, look at the stock's traded volume on the Movers page.
- Reading: a big percentage gain on very thin volume may be hard to realise; a sizeable order can move the price.
- Invalidation: if volume dries up in the sessions after listing, any paper gain is uncertain.
3. Size SME ideas smaller
- Reading: outcomes on the SME board are more widely spread, so a position that would be ordinary on the Mainboard is a larger risk there.
- Use: set position size by the board's spread of outcomes, not by the best recent listing.
How to test these
Collect past listings from the Recently Listed tab, split them by board, and compare the spread of listing gains and the volume in the following weeks. The difference between the two groups is the point of the exercise.
Where to go next
How to Read This Data
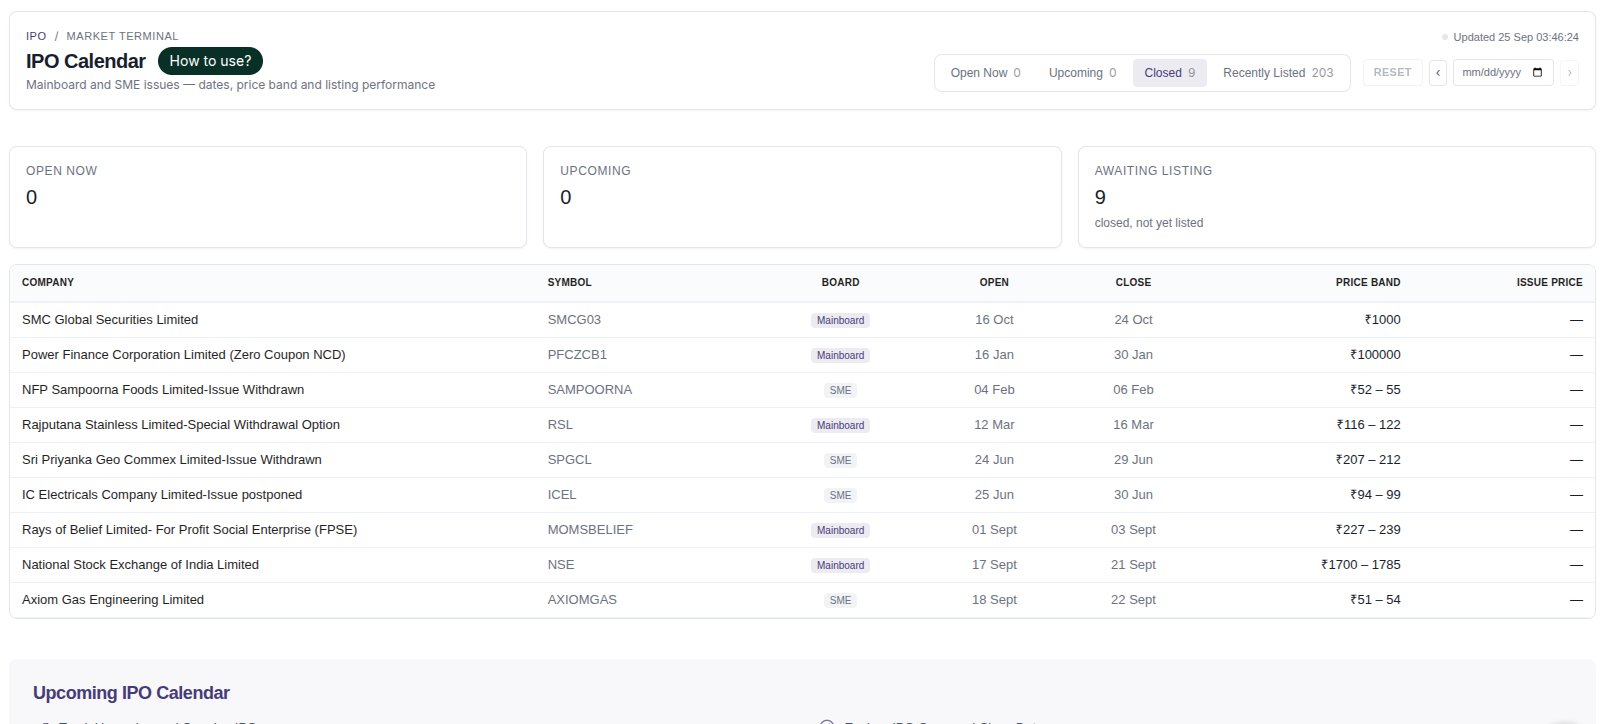
The IPO calendar lists open, upcoming and recently listed public issues with their price band, issue size, dates and listing performance. It is a reference for understanding the primary market and how new issues have behaved after listing.
- Separate mainboard issues from SME issues; they follow different rules and usually have different liquidity.
- Compare subscription levels across investor categories where available.
- Compare the listing price with the issue price to see each issue's listing gain or loss.
- Look at many past listings together instead of drawing conclusions from one issue.
Limitations: Past listing performance does not indicate how a future issue will list. New listings can be volatile and thinly traded in their first sessions.
More from the blog
- Strategy Backtesting on Unfluke
Backtest trading strategies on real Indian market data with Unfluke. Test equity, Nifty, Bank Nifty and options strategies with realistic costs and key metrics.
- Live Market Scanners
Explore Unfluke's real-time stock scanner for NSE markets. Scan 1,800+ stocks with 40+ technical indicators, fundamental filters, F&O data and custom rules.
- Option Strategy Simulator
Build and simulate multi-leg options strategies with Unfluke. Visualize payoffs, Greeks, max profit and loss, and replay historical option data from 2023.