Market Terminal
IV Rank Screener: Which NSE Options Are Expensive or Cheap Against Their Own Year
11 min read · Updated 9 Nov 2026
An implied volatility of 30% says nothing on its own. For NIFTY it would be a panic; for a volatile mid-cap it would be a quiet week. What option traders want to know is whether today's IV is high or low for that underlying, and that means comparing it with its own past.
The IV Rank Screener does that comparison for every F&O stock and index at once. It ranks each one's at-the-money IV against its own range over 3 months, 6 months or a year, flags the day's IV spikes and crushes, and sets IV beside the volatility the stock is actually delivering. This guide explains the numbers, reads the real 6 November 2026 screen, and turns it into a workflow and strategy ideas. For one underlying in depth, see the IV, HV, IV Rank and IV Percentile guide.
What IV Rank and IV Percentile are
Implied volatility, in one line
Implied volatility is the yearly volatility that option prices are paying for. The screener reads each underlying's at-the-money IV from the end-of-day option prices, on the nearest expiry with at least two days left: the weekly expiry for indices, the monthly for stocks.
IV Rank: where today sits in the range
IV Rank = (today's IV − lowest IV) ÷ (highest IV − lowest IV) × 100, over the look-back. 0 means IV is at its lowest of the period, 100 at its highest. It answers "how far up its range is IV?"
IV Percentile: how many days were lower
IV Percentile is the share of sessions in the look-back on which IV was lower than today. It answers "how unusual is today?" and is not thrown off by one extreme day.
Why the two disagree
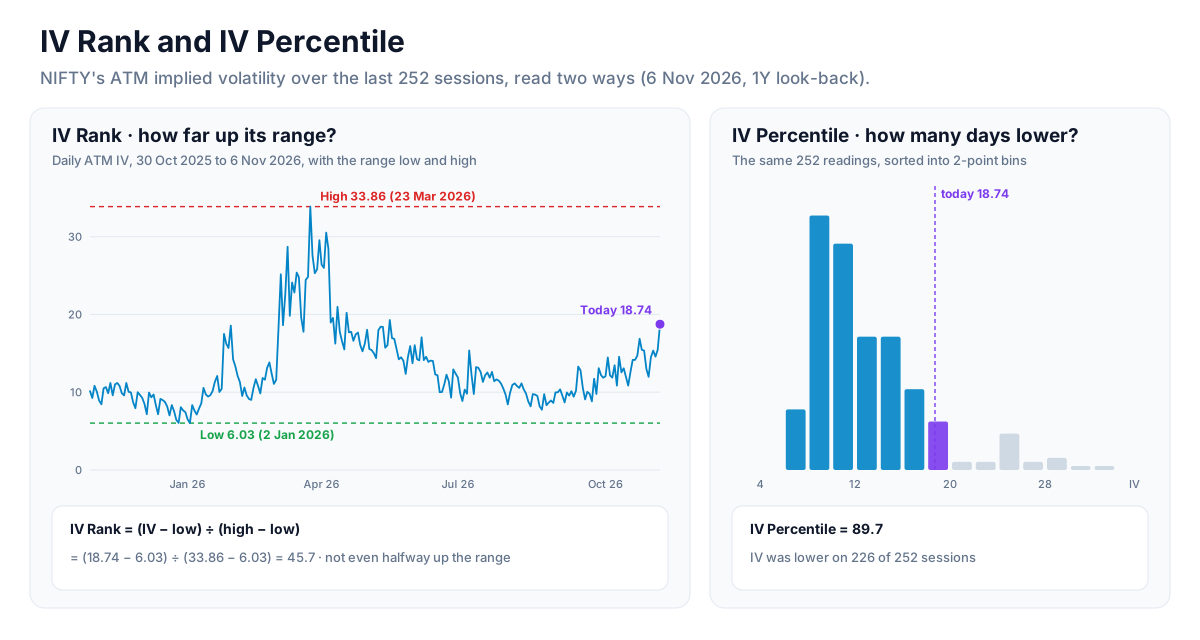
On 6 November 2026 NIFTY's IV was 18.74. Over the year it ranged from 6.03 (2 January) to 33.86 (23 March, during the spring sell-off). That one spike stretches the range, so IV Rank is only 45.7. Yet IV was lower than 18.74 on 226 of the 252 sessions, an IV Percentile of 89.7. Both are true: IV is high for a normal day, but well short of the panic high. When rank and percentile disagree this much, the range has an outlier in it, and the percentile is usually the better guide to "is this expensive?"
IV against realised volatility
The screener also shows HV20 and HV30, the volatility the underlying has actually delivered over 20 and 30 sessions (close to close, annualised over 252 days, adjusted for splits and bonuses), and IV − HV20. Positive means options are pricing more movement than the stock has been making. That gap is the premium option sellers are paid for taking risk; see the IV − HV guide.
Reading the real screen: 6 November 2026
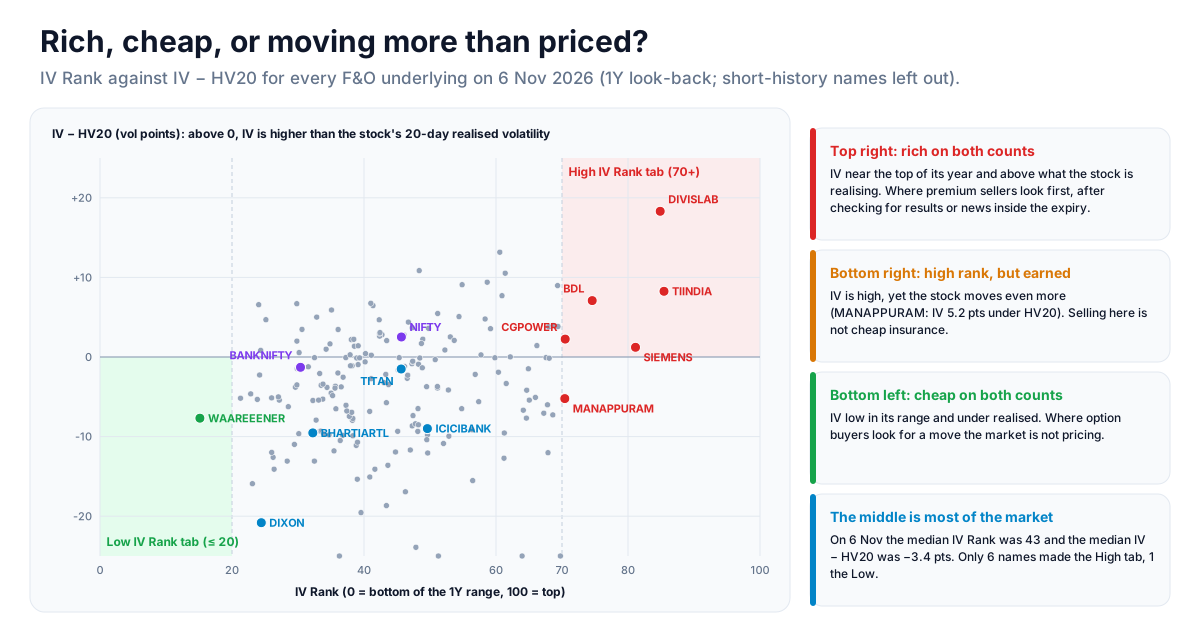
With the 1Y look-back the screener listed 223 underlyings: 6 in the High IV Rank tab, 1 in Low IV Rank, 19 Spiking, 8 Crushed and the 5 indices.
The indices on a rally day
- NIFTY: spot 25,030.35 (+2.01%), ATM IV 18.74 on the 9 November expiry, up 3.29 points on the day (+21%) and 6.76 points over 5 sessions. IV Rank 45.7, IVP 89.7, HV20 16.23, IV − HV20 +2.51. It was in the Spiking tab.
- BANKNIFTY: IV 16.32, up 2.42 points; IV Rank 30.4, IVP 72.2, IV − HV20 −1.30.
IV usually falls when the index rises. Here it rose with the index: the 2% rally was fast enough that traders paid up for options on both sides. A rising market with rising IV is a market that expects more movement, not a calm grind higher.
The High IV Rank tab
- DIVISLAB: IV 44.61, IV Rank 84.9, IVP 98.8, HV20 26.31, IV − HV20 +18.30. Options priced far more movement than the stock was delivering, and with reason: its board met on 7 November for quarterly results, inside the expiry.
- TIINDIA: IV 41.52, IV Rank 85.5, IVP 91.0, IV − HV20 +8.26. Its results came on 5 November; the stock fell 5.65% the next day and IV did not drop.
- SIEMENS: IV Rank 81.1 but IV − HV20 only +1.22: high IV, matched by high realised volatility.
- MANAPPURAM: IV Rank 70.4, but IV − HV20 −5.22. The stock was moving even more than its options priced.
Four names in the same tab, and none of them was simply "expensive". High IV Rank says IV is high for the underlying; IV − HV says whether the stock's own movement justifies it; and the results calendar says whether an event explains the rest. DIVISLAB looked the richest on the screen because results were a day away.
Spikes and crushes
- Spiking: SUPREMEIND +5.84 points (+22.2%) as the stock fell 4.07%; TATAPOWER +4.98 points (+19.5%).
- Crushed: TITAN −5.49 points (−19.9%) on a 3.44% rise; BHARTIARTL −3.16 points (−16.3%). Both had reported results on 5 November. A crush after results is the usual pattern: the uncertainty that was priced in is gone, whichever way the stock moved.
The only Low IV Rank name was WAAREEENER (IV Rank 15.1, IV − HV20 −7.69). 26 underlyings had less than 80% of a year of IV and were marked with their session count, NIFTYNXT50 among them with 82.
How to use it in a trade
- Choose the look-back for your trade. 1Y for a broad view of what is normal, 3M if the underlying's character has changed recently (a new index weight, a demerger). A short history makes a narrow range, which is why thin names are kept out of the High and Low tabs.
- Start from a tab. High IV Rank for premium-selling ideas, Low IV Rank for option-buying ideas, Spiking and Crushed for what changed today.
- Check IV against realised. High rank with IV − HV20 well above zero is the "rich" case. High rank with IV − HV20 below zero (MANAPPURAM) is a stock that is moving a lot; selling its options is not cheap insurance.
- Find the reason. High IV almost always has one: results inside the expiry, a court ruling, an index change. Check the results calendar before selling premium. IV that is high because results are next week is fair, not rich.
- Open the history. Click a row for its IV and HV20 over the look-back with the range lines, and use "Open on IV / HV / IVP" for the full chart. A spike that has already started to fall is a different trade from one still climbing.
- Mind the roll. A change marked with the roll icon compares IV read off two different expiries, so it is partly the roll. The screener never counts those as spikes or crushes.
Strategy ideas (ideas, not promises)
These are ideas to study, paper-trade and backtest, not recommendations or signals, and not a promise of any result. High IV can go higher, low IV can stay low, and selling options can lose more than the premium collected. Size, entries, exits and risk are your own decisions.
1. Rich on both counts: defined-risk premium selling
- Setup: High IV Rank tab, IV − HV20 of +5 points or more, no results or known event before the expiry.
- Idea: sell premium with defined risk (an iron condor or a credit spread) rather than naked options.
- Exit: a fixed share of the credit, or IV Rank falling back under 50.
- Invalidation: the underlying breaking out of its recent range, or HV20 rising to meet IV.
2. Cheap on both counts: buy the move
- Setup: Low IV Rank tab with IV − HV20 below zero and a chart pattern that suggests a breakout (a squeeze, a narrow range).
- Idea: long options or debit spreads, where both a move and a rise in IV help.
- Invalidation: the move not coming within a fixed number of sessions; time decay works against the buyer every day.
3. The post-event crush
- Setup: a stock in the High IV Rank tab with results in the next few sessions.
- Reading: IV tends to fall once results are out (TITAN, −5.49 points the day after its 5 November results). Study how far IV dropped after the last few results and how far the stock moved.
- Test: for each past result, compare the move the options priced with the move that came; the Results Reaction page does this for you.
4. Index IV rising with the index
- Setup: NIFTY in the Spiking tab on an up day, as on 6 November.
- Reading: the market is paying for movement on both sides. Be wary of short straddles into such a session, and consider whether long index exposure deserves a hedge.
How to test these
Use the date picker to step back through past sessions (the screener reaches back to 2024), export each day's tab to CSV, and track what happened to IV and to the underlying over the next 5 and 20 sessions. Build the option legs in the Option Simulator or the backtester before risking money.
Every tab, filter and column
The controls
- Date: any past session; the newest stored session on or before it is used.
- Look-back: 3M (63 sessions), 6M (126) or 1Y (252, the default). IV Rank, IV Percentile and the range use it.
- Search: filter by symbol.
- Export: the rows of the current tab as CSV.
The tabs
- All: every F&O underlying, indices first, then by IV Rank, highest first.
- High IV Rank: IV Rank 70 or above.
- Low IV Rank: IV Rank 20 or below.
- IV Spiking: IV up 10% or more on the day and by at least 1 vol point, on the same expiry.
- IV Crushed: IV down 10% or more and by at least 1 vol point, on the same expiry.
- Indices: NIFTY, BANKNIFTY, FINNIFTY, MIDCPNIFTY and NIFTYNXT50.
An underlying with fewer than 80% of the look-back's sessions of IV is shown with its session count and kept out of the High and Low tabs; one with fewer than 20 readings has no rank at all.
The columns
- Symbol, and Spot with its change on the day.
- ATM IV on the nearest expiry with two or more days left.
- 1D / 5D: IV change in vol points against the previous session and five sessions back; the roll icon marks a change across an expiry roll.
- IV Rank with a bar, and IVP.
- Range: the lowest and highest IV in the look-back.
- HV20, HV30 and IV − HV (IV minus HV20).
- 60D IV: a sparkline of the last 60 sessions of ATM IV.
Click a row for its IV and HV20 chart over the look-back. On a phone each underlying is a card with the same figures.
What the numbers are built from
Everything is end of day, from NSE's F&O Bhavcopy. Each session's ATM IV for every underlying is computed once and stored: Black-76 on the synthetic forward, using only contracts that traded that day (an untraded contract's price is stale and is left out). The expiry is the nearest one with at least two calendar days left, so an index usually reads the weekly. HV is close-to-close on the underlying's close, annualised over 252 trading days and adjusted for splits and bonuses. Because the IV comes from closing prices, a thinly traded stock option can show a jumpy IV; check its row chart before trusting a single day's spike.
Where to go next
For one underlying's IV, HV and IVP over a year, read the IV / HV / IVP guide; for the premium sellers earn, the IV − HV guide; and for IV across strikes, the volatility skew guide. Open the page at Open Interest → IV Rank Screener, or sign up free to run it yourself.
More from the blog
- Strategy Backtesting on Unfluke
Backtest trading strategies on real Indian market data with Unfluke. Test equity, Nifty, Bank Nifty and options strategies with realistic costs and key metrics.
- Live Market Scanners
Explore Unfluke's real-time stock scanner for NSE markets. Scan 1,800+ stocks with 40+ technical indicators, fundamental filters, F&O data and custom rules.
- Option Strategy Simulator
Build and simulate multi-leg options strategies with Unfluke. Visualize payoffs, Greeks, max profit and loss, and replay historical option data from 2023.