Market Terminal
F&O Lot Size Changes: What They Are and How to Track Them
8 min read · Updated 2 Nov 2026
The Lot Size Changes page lists the current F&O lot size for every symbol and every time that lot size has been revised.
This article explains what a lot size is, how to read the page, and why a revision changes the value of one contract.
What is an F&O lot size?
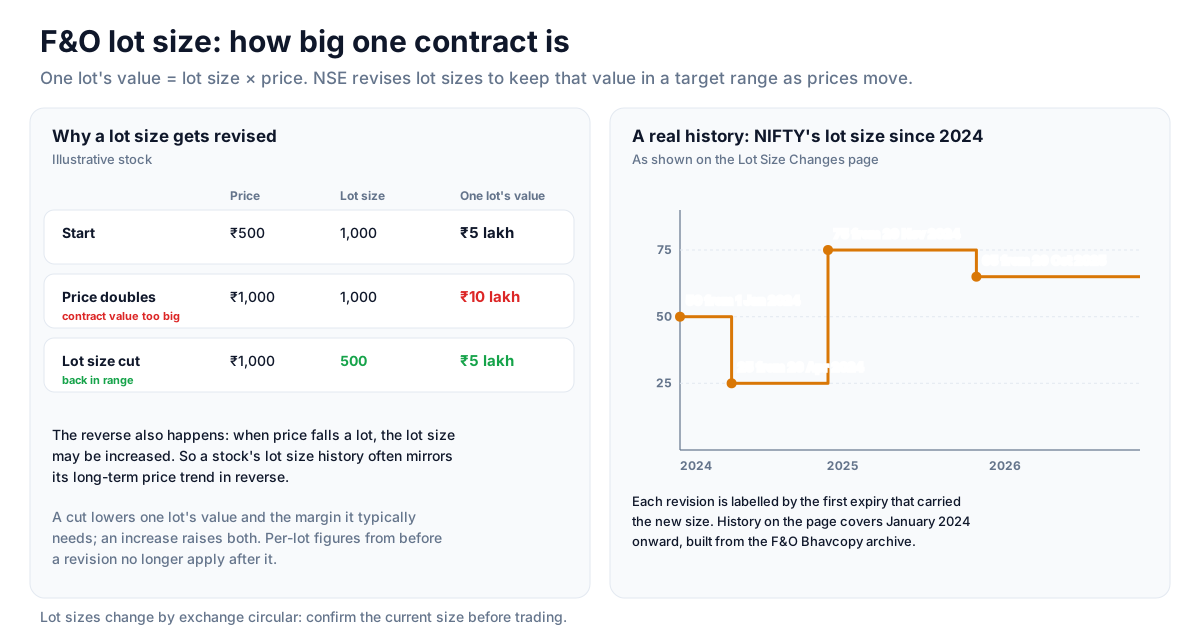
F&O contracts trade in fixed lots. The lot size is the number of units of the underlying in one contract - so one lot's notional value is the lot size multiplied by the price. NSE reviews lot sizes periodically and changes them to keep contract values within a target range as prices move.
Unfluke builds this page from the F&O Bhavcopy archive, so the history covers January 2024 onward. Each revision is labelled by the first expiry that carried the new size.
How to read it
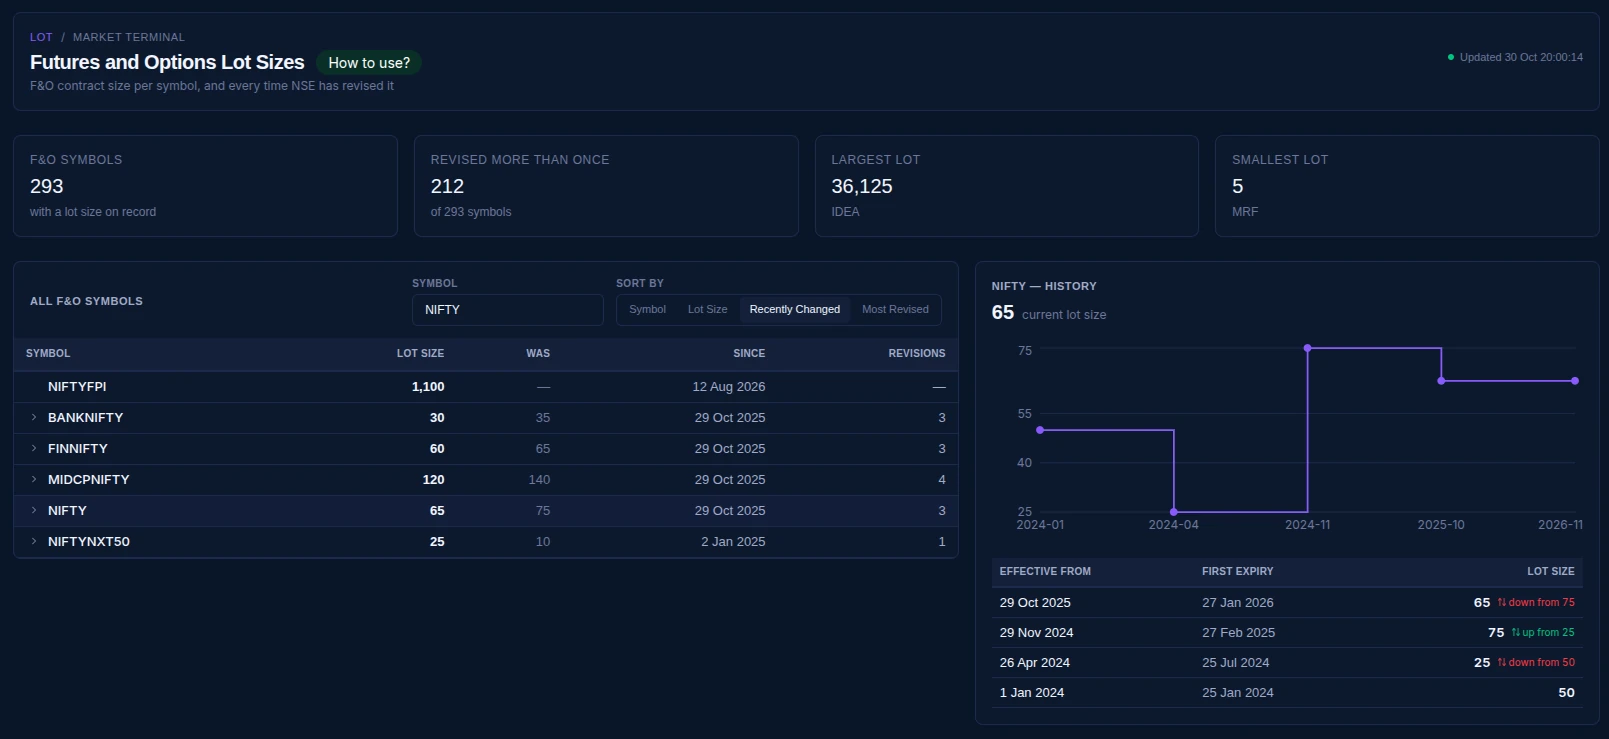
- F&O Symbols - how many symbols have a lot size on record.
- Revised More Than Once - how many symbols have had more than one revision.
- Largest Lot / Smallest Lot - the extremes across all symbols, with the symbol named underneath.
- Search and sort - filter by symbol and sort by Symbol, Lot Size, Recently Changed or Most Revised.
- Lot Size - the current lot size. Was - the size before the latest change. Since - when the current size took effect. Revisions - how many sizes are on record.
- History - select a symbol to see a step chart of its lot size over time and a table with Effective From, First Expiry and Lot Size for each change.
How to use it
Sort by Recently Changed to see which symbols were revised lately, then open a symbol's history to see the full sequence. For a symbol you have not followed for a while, the current lot size shows whether older contract values still apply.
Why lot sizes change
As a stock's price rises a lot, one contract's value grows with it, so NSE may reduce the lot size to bring the contract value back into range. When price falls, the lot size may be increased. The step chart makes this visible - a symbol's lot size history often mirrors its long-term price trend in reverse.
How a revision changes contract value
Because contract value is lot size times price, a lot size cut lowers the value of one lot and the margin it typically needs, and an increase raises both. Per-lot figures from before a revision therefore no longer apply after it.
What frequent revisions suggest
Symbols near the top of Most Revised have usually seen large price changes over time, since that is what triggers revisions. It is a rough, indirect hint of how much a stock has moved historically - useful background, not a measure of volatility on its own.
Strategy ideas (ideas, not promises)
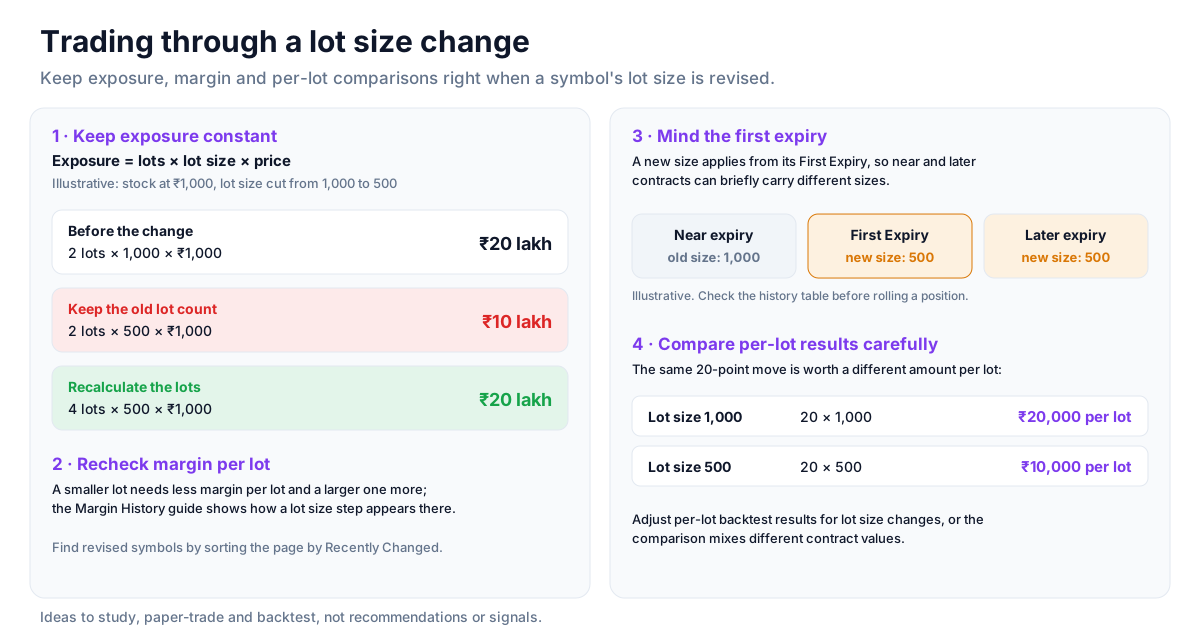
These are ideas to study, paper-trade and backtest, not recommendations or signals, and not a promise of any result. Lot sizes change by exchange circular; confirm the current size before trading. Size, entries, exits and risk are your own decisions.
1. Keep exposure constant after a revision
- Setup: a symbol whose lot size changed (sort by Recently Changed).
- Idea: notional = lots × lot size × price. Recalculate how many lots give the exposure you want instead of keeping the old lot count.
2. Recheck margin per lot
- Reading: a smaller lot needs less margin per lot and a larger one more; the Margin History guide shows how a lot size step appears in margin.
3. Mind the first expiry
- Reading: a new size applies from its First Expiry, so near and later contracts can briefly carry different sizes. Check the history table before rolling a position.
4. Compare per-lot results carefully
- Idea: when comparing a strategy's per-lot profit across periods, adjust for lot size changes or the comparison mixes different contract values.
How to test these
Open a symbol's history, note the dates of each change, and compare per-lot backtest results on Unfluke before and after each revision.
Where to go next
Return to the derivatives data guide or read option Greeks explained. Check lot sizes free.
How to Read This Data
A lot size is the number of units in one futures or options contract. Exchanges revise lot sizes periodically, which changes the value represented by one contract. The lot-size screen is a reference for current sizes and the history of changes.
- Check the effective date of a change; contracts listed before and after it can have different sizes.
- Multiply lot size by price to see the notional value of one contract.
- Compare old and new sizes to see how much the contract value changed.
- Note that exchanges usually revise sizes to keep contract values within a set range.
Limitations: Lot sizes change by exchange circular. Always confirm the current specification with the exchange, because this page is a reference and can lag a fresh announcement.
More from the blog
- Strategy Backtesting on Unfluke
Backtest trading strategies on real Indian market data with Unfluke. Test equity, Nifty, Bank Nifty and options strategies with realistic costs and key metrics.
- Live Market Scanners
Explore Unfluke's real-time stock scanner for NSE markets. Scan 1,800+ stocks with 40+ technical indicators, fundamental filters, F&O data and custom rules.
- Option Strategy Simulator
Build and simulate multi-leg options strategies with Unfluke. Visualize payoffs, Greeks, max profit and loss, and replay historical option data from 2023.