Market Terminal
Option Chain Analysis: Reading Option Greeks and IV
10 min read · Updated 2 Nov 2026
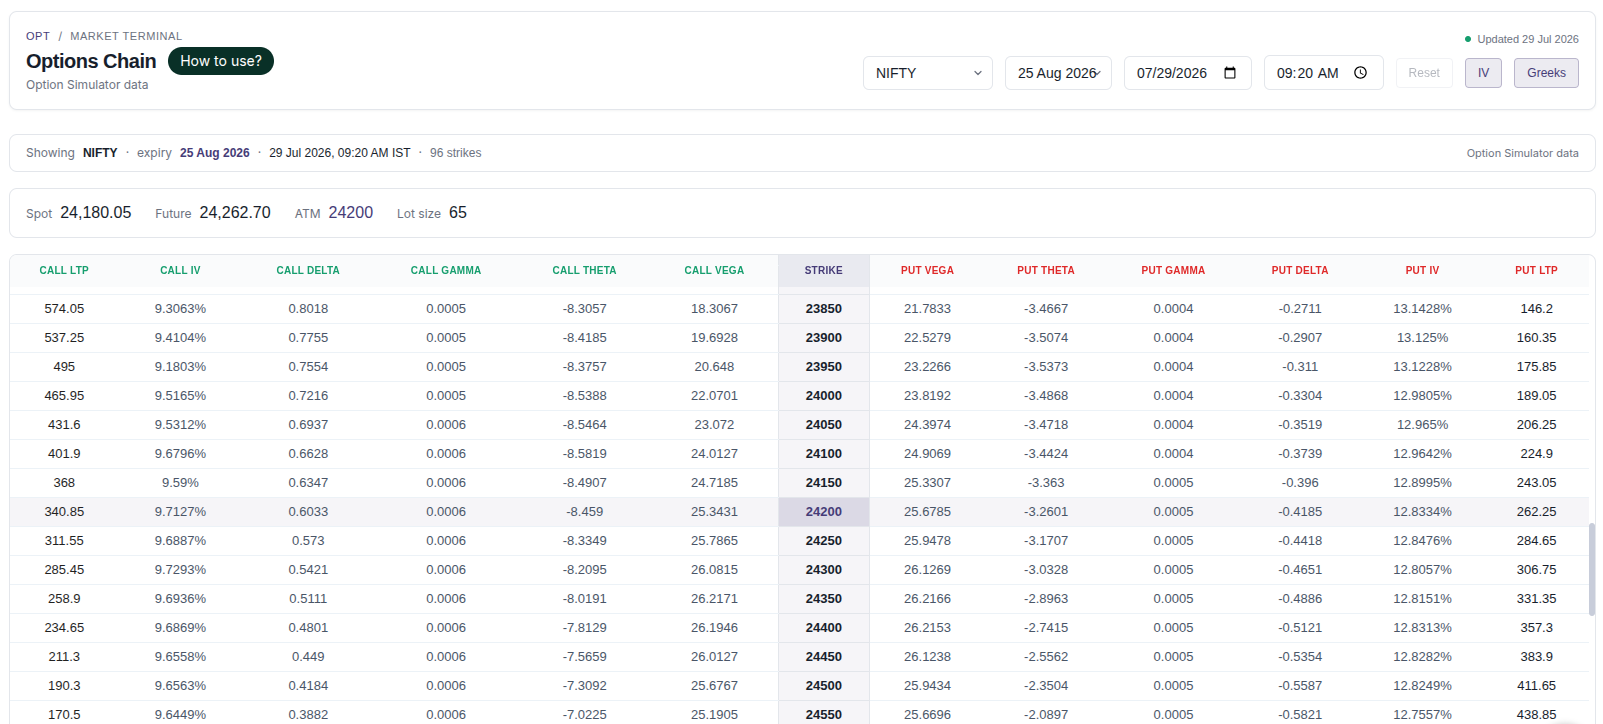
The Option Chain page shows call and put prices, implied volatility and all four Greeks for every strike of an instrument and expiry, at a chosen date and minute.
This article explains what an option chain is, how to read each part of the page, and how the Greeks describe the way different options structures behave.
What is an option chain?
An option chain is a table of all the option contracts available for one underlying and one expiry. Each row is a strike price; calls sit on one side of the strike and puts on the other. It is the standard starting point for options research because it shows, in one view, how the market is pricing every strike.
Unfluke's Option Chain is built from the Option Simulator's stored data, so you can look at the chain as it stood at a past date and minute, not only at the current moment. It shows prices, IV and Greeks. Open interest, PCR and Max Pain are not part of this page - put call ratio has its own PCR & Max Pain page.
How to read it
- Instrument, Expiry, Date, Time - choose what the chain shows. Time moves in one-minute steps during market hours; Reset returns to the series' first day at 09:20.
- Showing strip - confirms the instrument, expiry, date and time on screen and how many strikes are listed.
- Spot - the underlying's price at that minute. Future - the futures price. ATM - the at-the-money strike, the one closest to spot. Lot size - units per contract.
- Strike - the centre column. The ATM row is highlighted so you can find it quickly.
- Call LTP / Put LTP - the option's last traded price (premium per unit) at that minute.
- Call IV / Put IV - implied volatility, in percent: the volatility level the option's price implies. Hide or show with the IV button.
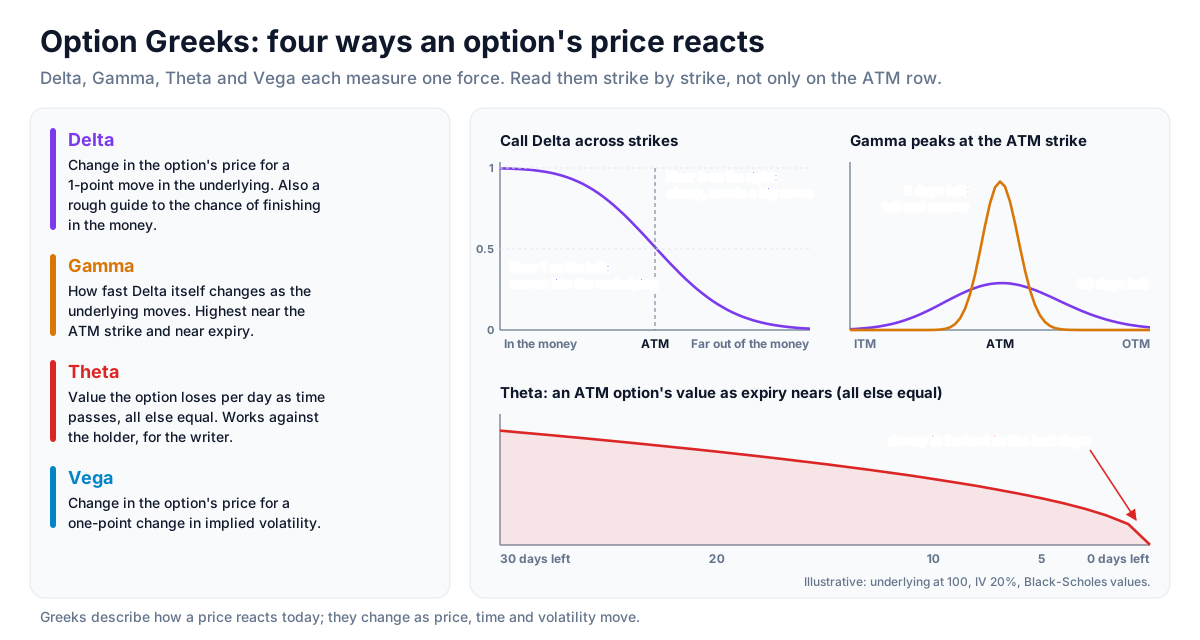
- Delta - how much the option price changes for a ₹1 move in the underlying; also a rough proxy for the chance of finishing in the money.
- Gamma - how fast Delta itself changes as the underlying moves.
- Theta - the value an option loses per day from time passing, all else equal.
- Vega - how much the option price changes for a one-point change in implied volatility. Greeks can be hidden with the Greeks button.
How to use it
A simple research workflow: pick the instrument and expiry, find the highlighted ATM strike, then read outward. Compare IV across strikes to see where options are priced richer or cheaper, and compare Theta and Gamma between near-ATM and far strikes to see how differently they behave.
Because the page keeps history, you can also step through a past session minute by minute - for example, to study how premiums, IV and Delta shifted around a large move in the underlying.
Delta and directional exposure
Delta describes how directional an option position is. A deep in-the-money option with high Delta moves almost like the underlying and carries a higher premium. A far out-of-the-money option with low Delta is cheaper but has a lower probability of ending in the money. Delta shows how sensitive each strike is to the underlying - something the size of the premium alone does not reveal.
Theta - time decay explained
Theta measures how much value an option loses as time passes, all else equal. That decay works against the holder of an option and in the opposite direction for its writer. It is usually largest for near-ATM options close to expiry, which is why Theta is best compared on the exact strike and expiry being studied rather than only on the ATM row.
Gamma and Vega - how fast risk can change
Gamma is highest near the ATM strike and near expiry, which is why short-dated ATM options can shift from roughly neutral to strongly directional within minutes. Vega matters when implied volatility is expected to move on its own - around results, budget days or global events. A position with high Vega can change in value even when the underlying barely moves.
How Greeks describe common option structures
Textbooks often describe option structures by their Greeks. Directional structures carry meaningful Delta. Net-written spreads are mainly sensitive to Theta. Volatility structures such as straddles carry positive Vega and Gamma - see IV and straddles/strangles. Structures that aim to remove direction are covered in delta-neutral positions. These are concepts for study, not recommendations.
Strategy ideas (ideas, not promises)
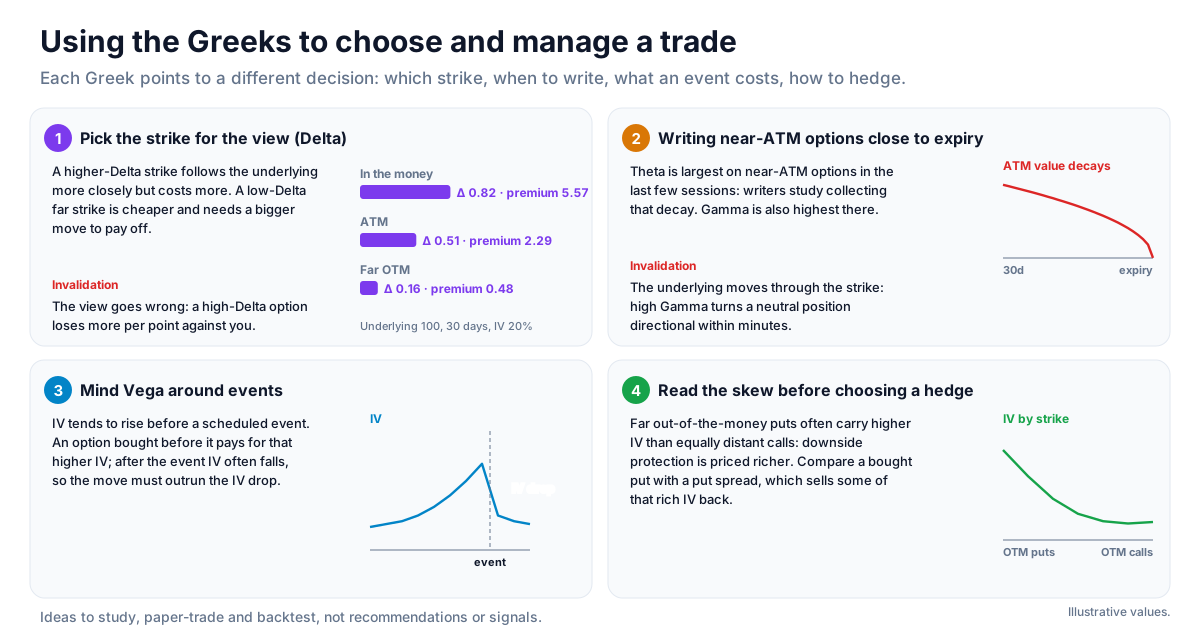
These are ideas to study, paper-trade and backtest, not recommendations or signals, and not a promise of any result. Greeks describe how an option's price reacts today; they change as price, time and volatility move. Size, entries, exits and risk are your own decisions.
1. Pick the strike for the view (Delta)
- Setup: a directional view on the underlying.
- Reading: a higher-Delta strike (in or near the money) follows the underlying more closely but costs more; a low-Delta far strike is cheaper and needs a bigger move to pay off.
- Invalidation: the view going wrong: a high-Delta option loses more rupees per point against you.
2. Writing near-ATM options close to expiry (Theta and Gamma)
- Setup: near-ATM options in the last few sessions before expiry, where Theta is largest.
- Idea: writers study collecting that decay, knowing Gamma is also highest there.
- Invalidation: the underlying moving through the strike: high Gamma turns a neutral position directional within minutes.
3. Mind Vega around events
- Setup: results, budget or other scheduled events, when IV tends to rise beforehand.
- Reading: an option bought before the event pays for that higher IV; after the event IV often falls, so the move must outrun the IV drop.
4. Read the skew before choosing a hedge
- Setup: far out-of-the-money puts with higher IV than equally distant calls.
- Reading: downside protection is priced richer; compare a bought put with a put spread, which sells some of that rich IV back.
How to test these
Step through past sessions minute by minute on the Option Chain and watch how Delta, Theta and IV of a chosen strike changed into expiry or an event. Structures can be built and replayed on Unfluke's Option Simulator and backtested on the backtester.
Where to go next
Continue to delta-neutral positions or return to the derivatives data guide. Try the Option Chain free.
How to Read This Data
An option chain lists every call and put for an expiry by strike price, with open interest, volume, price, implied volatility (IV) and the Greeks. It is the standard way to study how options are priced and where positions are concentrated.
- Locate the at-the-money strike; strikes closer to it usually have higher volume and tighter bid-ask spreads.
- Read IV across strikes to see how the market prices expected movement (often called the volatility smile or skew).
- Compare open interest across strikes to see where positions are concentrated.
- Read the Greeks to understand sensitivity: delta to price, theta to time, vega to volatility.
Limitations: Option prices and Greeks change continuously. A historical chain shows one moment in time, and open interest does not reveal whether positions are hedged.
More from the blog
- Strategy Backtesting on Unfluke
Backtest trading strategies on real Indian market data with Unfluke. Test equity, Nifty, Bank Nifty and options strategies with realistic costs and key metrics.
- Live Market Scanners
Explore Unfluke's real-time stock scanner for NSE markets. Scan 1,800+ stocks with 40+ technical indicators, fundamental filters, F&O data and custom rules.
- Option Strategy Simulator
Build and simulate multi-leg options strategies with Unfluke. Visualize payoffs, Greeks, max profit and loss, and replay historical option data from 2023.