Market Terminal
Stock Market Seasonality in India: How to Read the Returns Heatmap
9 min read · Updated 2 Nov 2026
The Returns Heatmap colour-codes the weekly, monthly or yearly returns of an instrument such as Nifty 50 or gold, from deep red for the worst periods to deep green for the best, going back to 2000.
This guide explains how to read the grids and stats, and how the data is used to study seasonality - whether certain months have historically tended to be stronger or weaker.
What is a returns heatmap?
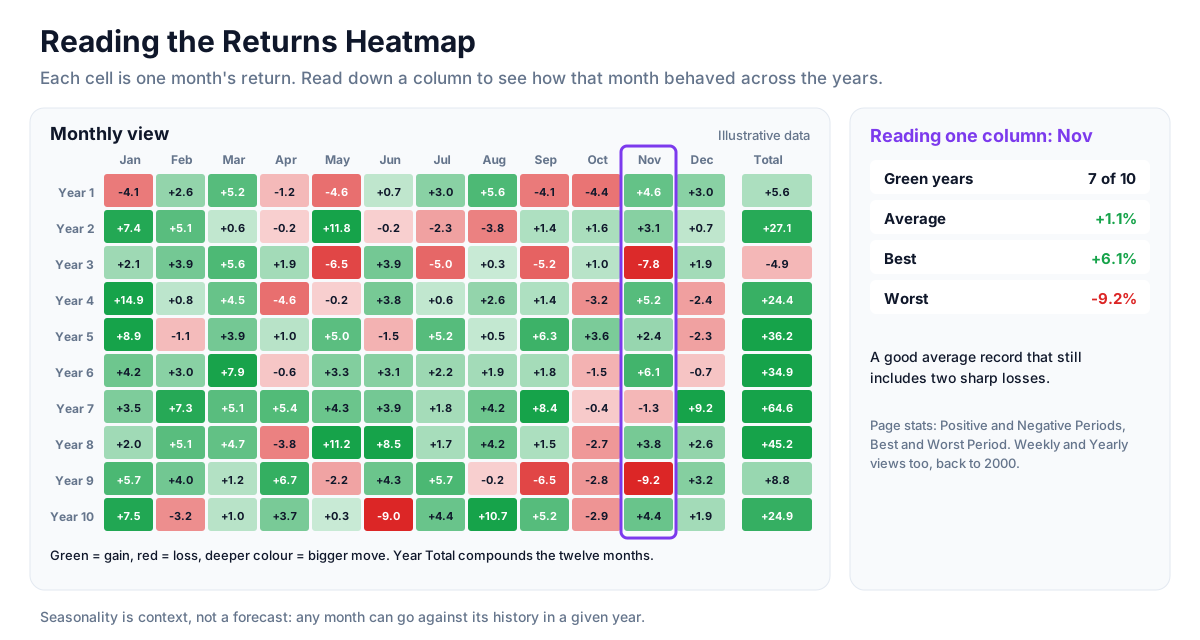
A returns heatmap lays out the percentage return of every period in a grid and colours each cell by the size of the move. It turns two decades of history into one picture, so patterns across years and calendar months are visible at a glance. The data comes from weekly price bars, which are also listed in full below the heatmap.
How to read it
- Instrument selector - choose the instrument, such as Nifty 50, Nifty Bank, Sensex or gold.
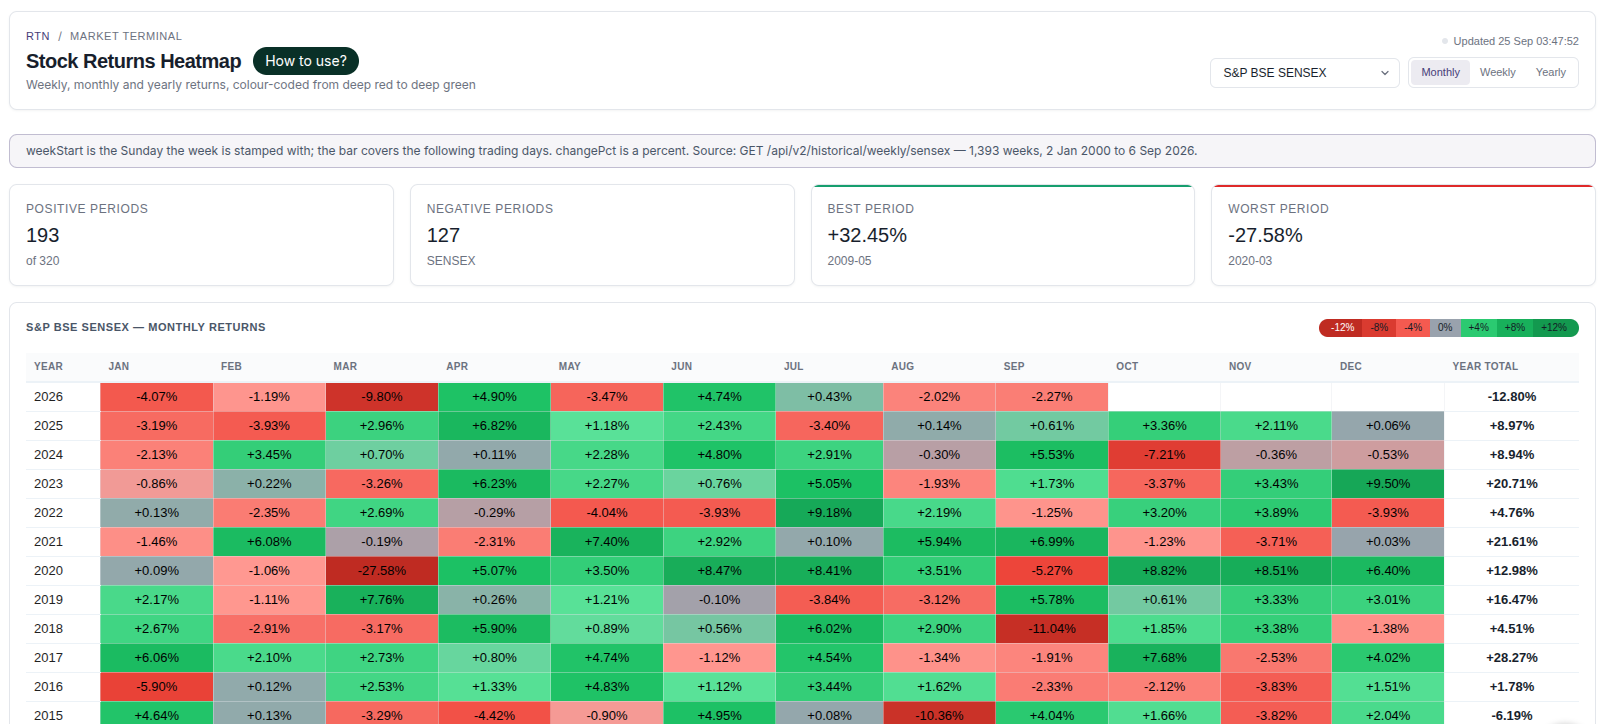
- Weekly / Monthly / Yearly - switch the grid. Monthly is a year-by-month table with a Year Total column; Weekly is a year-by-week table; Yearly is one cell per year.
- Colour - green cells are gains, red cells are losses; deeper colour means a larger move. Hover a cell for the exact figure.
- Positive / Negative Periods - how many periods in the current view ended up or down.
- Best / Worst Period - the single largest gain and loss in the view, with the period it happened in.
- Every Week table - the underlying weekly bars: week start, open, high, low, close, change and volume.
Using the page for research
- In the Monthly view, read down a single month's column to see how that month has behaved across all years.
- Count green versus red cells in that column to get a rough "hit rate" for the month.
- Look for clusters: a month that was strong mostly in one decade tells a different story from one that has been strong throughout.
- Switch to gold for the same months to see whether a pattern is specific to equities.
Seasonality as context, not a forecast
Sayings like "Sell in May" are examples of seasonality folklore; the heatmap lets you check such ideas against actual Indian market history. Even a month with a strong historical record can be negative in any given year, and past patterns can fade as markets change. Seasonality is best used as one piece of background context alongside valuation, flows and price action.
Strategy ideas (ideas, not promises)
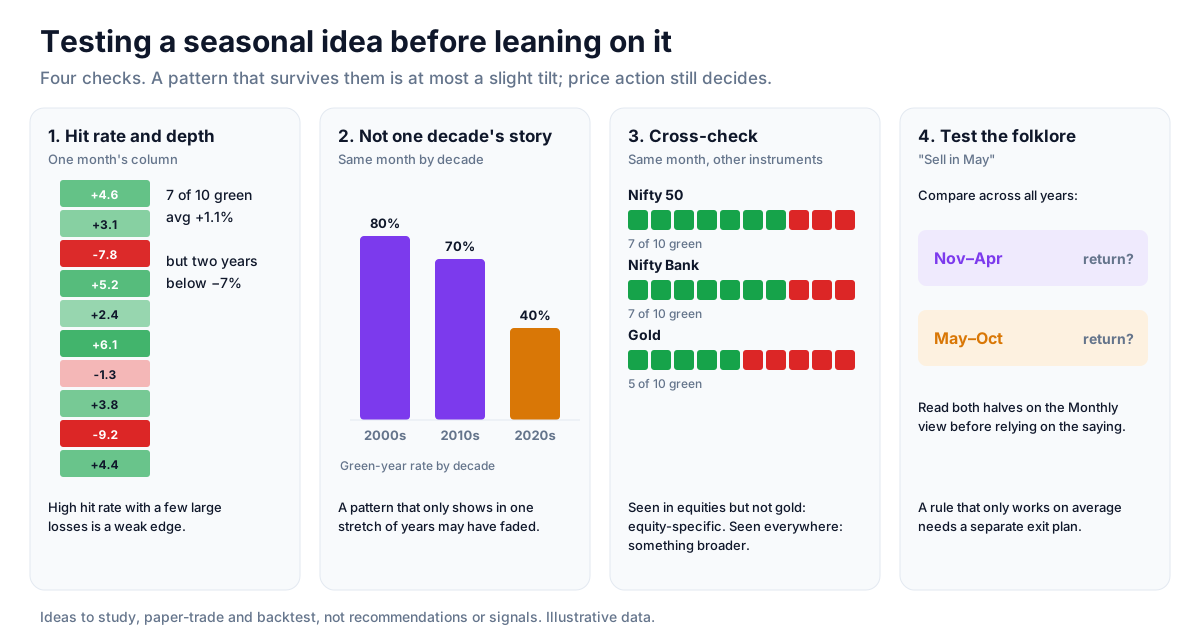
These are ideas to study, paper-trade and backtest, not recommendations or signals, and not a promise of any result. Any month can go against its history in a given year. Size, entries, exits and risk are your own decisions.
1. Use a month's record as a tilt, not a signal
- Setup: a month's column in the Monthly view for Nifty 50.
- Reading: count green against red years and note the deepest red cells. A high hit rate with a few large losses is a weak edge.
- Use: at most, lean slightly with a strong seasonal record while price action still decides.
2. Check that the pattern is not one decade's story
- Setup: the same month across 2000s, 2010s and 2020s.
- Reading: a pattern that only appears in one stretch of years may have faded.
3. Cross-check with another instrument
- Setup: switch to Nifty Bank, Sensex or gold for the same month.
- Reading: a pattern seen in equities but not gold is equity-specific; one seen everywhere may come from something broader.
4. Test the folklore
- Setup: a saying such as Sell in May.
- Reading: read May to October against November to April on the Monthly view before relying on it.
How to test these
Write down a seasonal rule (for example, a month's direction), then check how it did year by year on the heatmap and how large the losing years were. A rule that only works on average, with deep losing years, needs a separate exit plan.
Where to go next
Read what decades of yearly returns show next, or return to the reference data guide. Try the Returns Heatmap free.
How to Read This Data
A returns heatmap arranges returns by period in a colour grid, which makes it easy to compare months or years and spot seasonality — the tendency of some periods to have performed differently in the past.
- Check the period and comparison basis before reading the colours.
- Look for patterns that repeat across many years rather than one unusually strong cell.
- Count how many years a pattern held and how many it did not.
- Compare the size of returns, not only their colour; small positive and large positive cells can share a shade.
Limitations: Seasonal patterns are drawn from limited history and can disappear. A pattern in past data is not evidence that it will repeat.
More from the blog
- Strategy Backtesting on Unfluke
Backtest trading strategies on real Indian market data with Unfluke. Test equity, Nifty, Bank Nifty and options strategies with realistic costs and key metrics.
- Live Market Scanners
Explore Unfluke's real-time stock scanner for NSE markets. Scan 1,800+ stocks with 40+ technical indicators, fundamental filters, F&O data and custom rules.
- Option Strategy Simulator
Build and simulate multi-leg options strategies with Unfluke. Visualize payoffs, Greeks, max profit and loss, and replay historical option data from 2023.