Market Terminal
What Decades of Yearly Returns Tell Long-Term Investors
7 min read · Updated 2 Nov 2026
The Yearly view of the Returns Heatmap shows one cell per year back to 2000. It is less a trading tool than a way to set realistic expectations about long-term returns.
Seeing the full range of outcomes
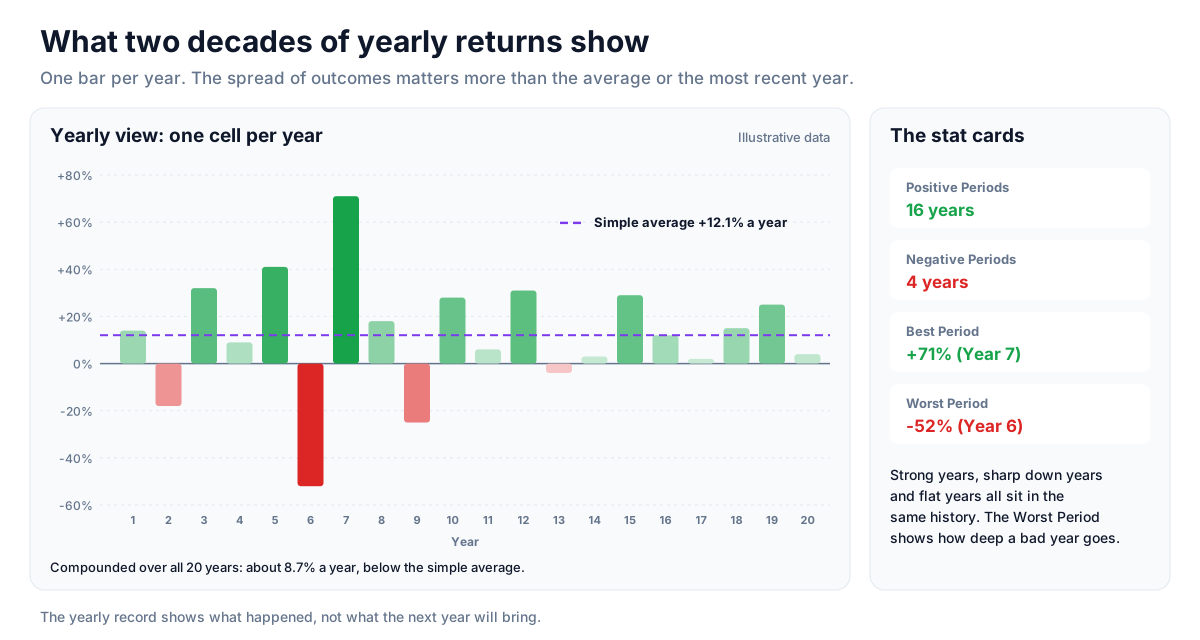
Two decades of yearly returns in one strip make the real spread of outcomes concrete: strong up years, sharp down years, and years that went nowhere. That is more informative than any single recent year, which is easy to over-weight in memory.
Down years and drawdown awareness
The Worst Period card in the Yearly view shows how large a single calendar-year loss has been. It is a useful reminder of how deep a bad year can go for an all-equity portfolio, and why investment horizon matters.
Context for systematic investing
For people investing a fixed amount every month, the yearly record read alongside the monthly grid helps with a common question - does the choice of month matter? Over long periods the yearly record tends to show that staying consistent has mattered more than the month chosen.
History together with today's valuation
The yearly record shows what has happened, not what will. Reading it alongside current valuation avoids assuming that average historical returns repeat from any starting point.
Strategy ideas (ideas, not promises)
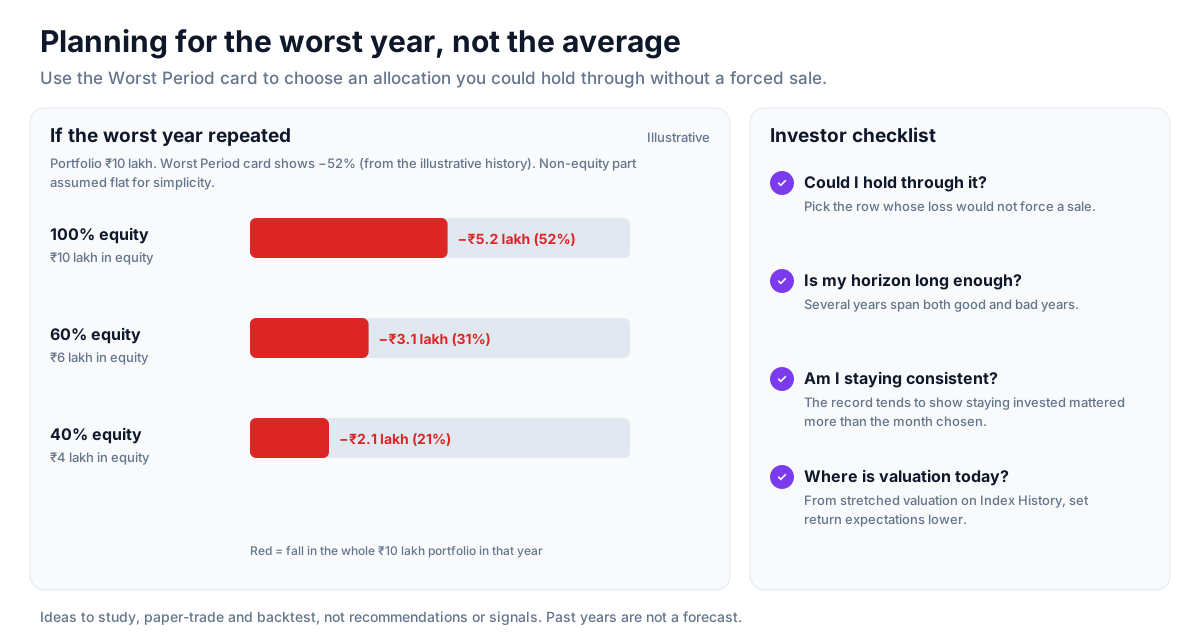
These are ideas to study, paper-trade and backtest, not recommendations or signals, and not a promise of any result. Past yearly returns describe what happened, not what the next year will bring. Size, entries, exits and risk are your own decisions.
1. Plan for the worst year, not the average
- Setup: the Worst Period card in the Yearly view.
- Reading: an all-equity portfolio has to survive a year like that; it sets the drawdown to plan for.
- Use: choose allocation and horizon so that a repeat of the worst year would not force a sale.
2. Stay consistent with systematic investing
- Setup: a monthly investing plan.
- Reading: over long periods the yearly record tends to show that staying invested mattered more than the month chosen.
3. Adjust expectations with valuation
- Setup: read today's valuation on Index History alongside the yearly record.
- Reading: average past returns are less likely from a starting point of stretched valuation; set expectations lower then.
How to test these
Pick several past start years and compute what holding through the following five years returned from the yearly cells, then compare with the valuation at each start date on Index History.
Where to go next
How to Read This Data
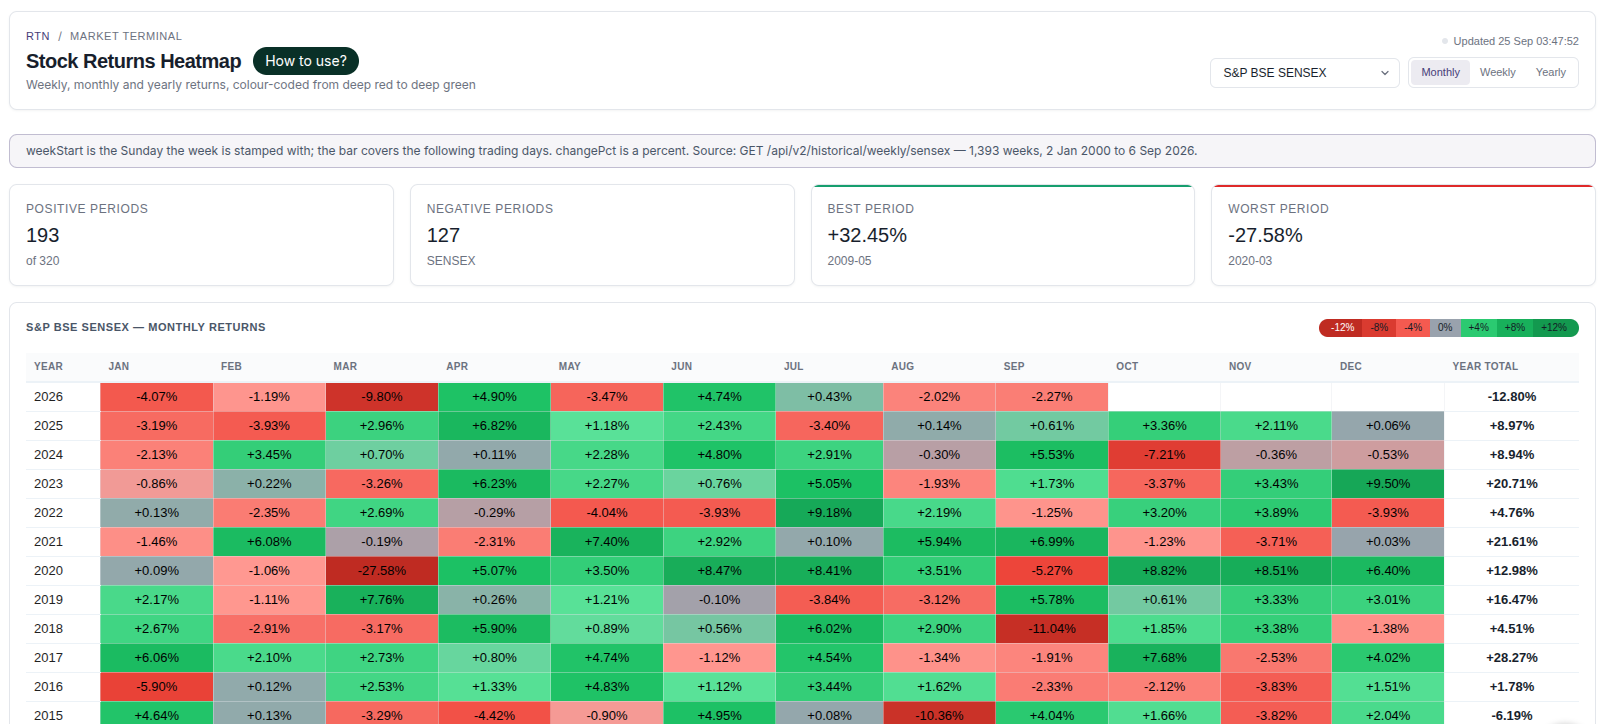
A returns heatmap arranges returns by period in a colour grid, which makes it easy to compare months or years and spot seasonality — the tendency of some periods to have performed differently in the past.
- Check the period and comparison basis before reading the colours.
- Look for patterns that repeat across many years rather than one unusually strong cell.
- Count how many years a pattern held and how many it did not.
- Compare the size of returns, not only their colour; small positive and large positive cells can share a shade.
Limitations: Seasonal patterns are drawn from limited history and can disappear. A pattern in past data is not evidence that it will repeat.
More from the blog
- Strategy Backtesting on Unfluke
Backtest trading strategies on real Indian market data with Unfluke. Test equity, Nifty, Bank Nifty and options strategies with realistic costs and key metrics.
- Live Market Scanners
Explore Unfluke's real-time stock scanner for NSE markets. Scan 1,800+ stocks with 40+ technical indicators, fundamental filters, F&O data and custom rules.
- Option Strategy Simulator
Build and simulate multi-leg options strategies with Unfluke. Visualize payoffs, Greeks, max profit and loss, and replay historical option data from 2023.