Market Terminal
Most Active F&O Contracts and Underlyings: How to Read Them
9 min read · Updated 2 Nov 2026
The Derivatives Activity page ranks where F&O trading is concentrated: the most active contracts, the most active underlyings, and contracts with unusual jumps in open interest.
This article explains each tab, how to read the columns, and what turnover concentration does and does not tell you.
What is derivatives activity data?
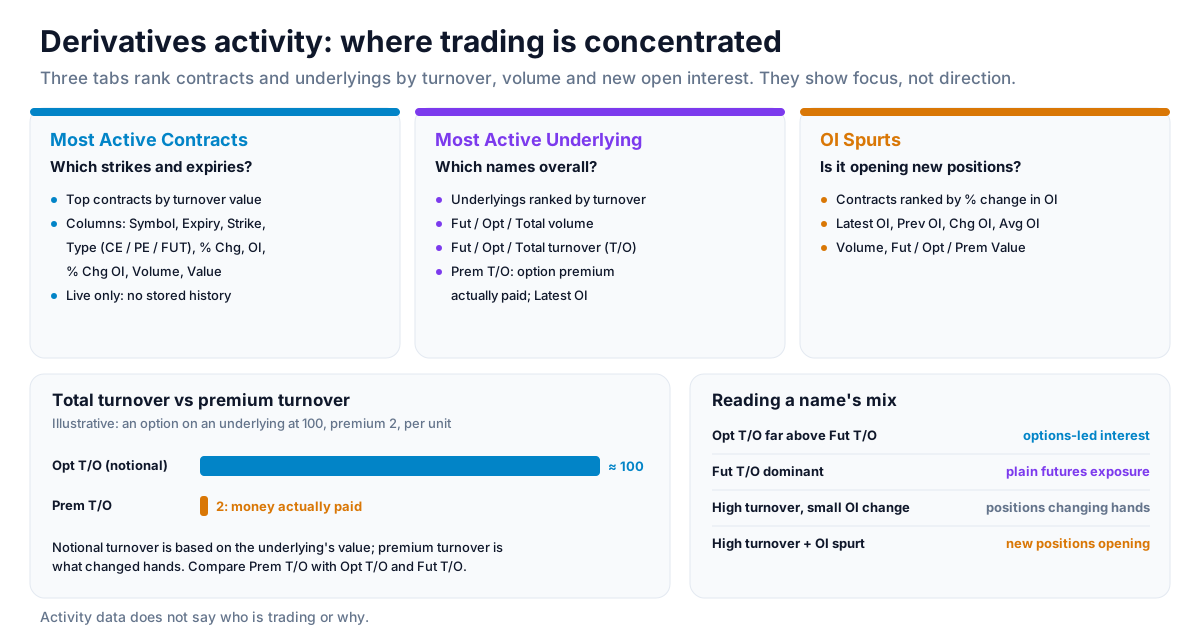
F&O activity data shows where trading volume and turnover are concentrated across futures and options. It does not say who is trading or why, but it does show which strikes and underlyings the market is focused on. Unfluke's page has three tabs: Most Active Contracts (live only, no stored history), Most Active Underlying and OI Spurts.
How to read it
- Most Active Contracts chart - top contracts by turnover value, in ₹ lakh.
- Contracts table - Symbol, Expiry, Strike, Type (CE/PE/FUT), % Chg (price), OI, % Chg OI, Volume (contracts traded) and Value (₹ lakh).
- Most Active Underlying chart - underlyings ranked by turnover, in ₹ crore.
- Underlying table - Fut Vol, Opt Vol and Total Vol (volume in futures, options and combined), Fut T/O, Opt T/O and Total T/O (turnover), Prem T/O (premium turnover - the value of option premiums actually paid), Latest OI and Underlying (the underlying's price).
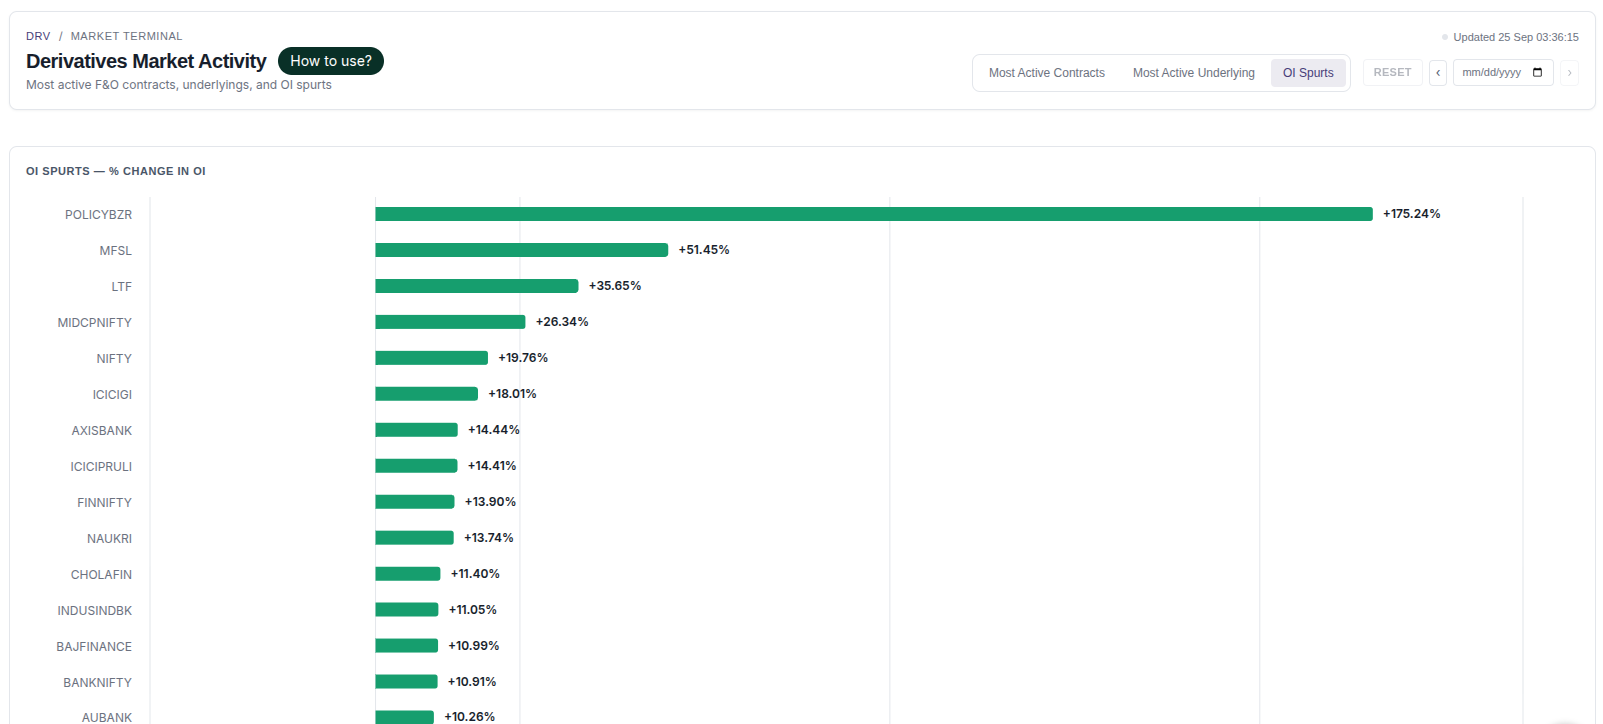
- OI Spurts chart - contracts ranked by % change in OI.
- OI Spurts table - Latest OI, Prev OI, Chg OI, Avg OI, Volume, Fut Value, Opt Value, Total, Prem Value and Underlying.
How to use it
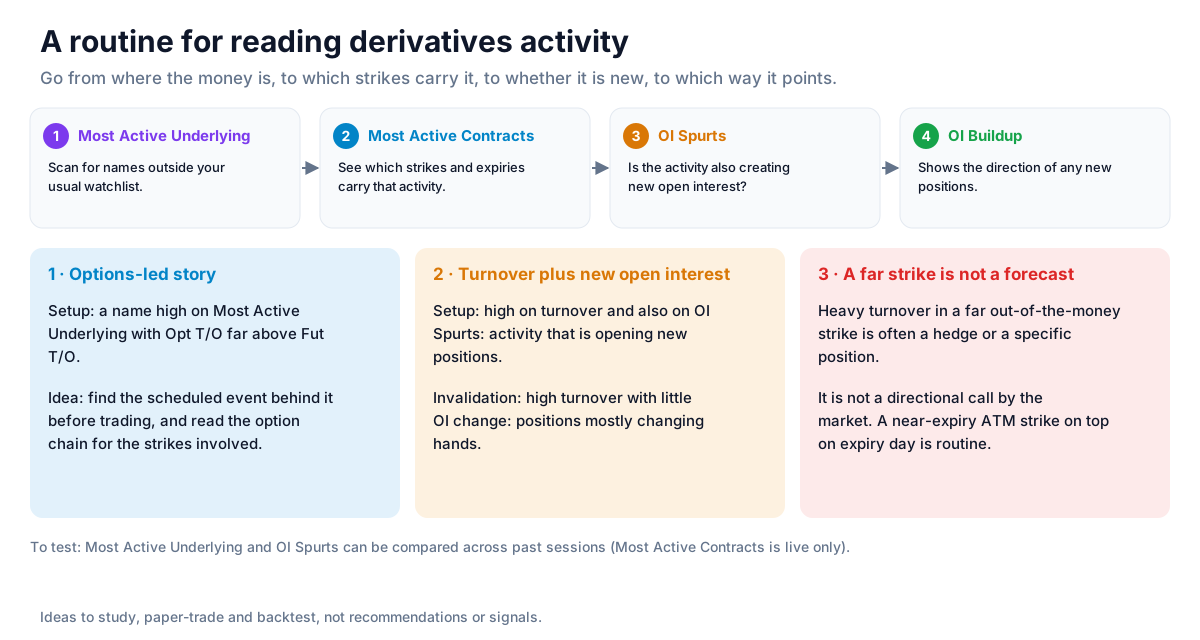
A simple routine is to scan Most Active Underlying for names outside your usual watchlist, open Most Active Contracts to see which strikes and expiries carry that activity, then check OI Spurts to see whether the activity is also creating new open interest. From there, the OI Buildup page shows the direction of any new positions.
Contract level - which strikes the market is focused on
A strike near the current price at the top of Most Active Contracts is normal. A far out-of-the-money strike with unusually heavy turnover is less common and often reflects a specific hedge or position - context that news and the calendar can help explain.
Underlying level - premium turnover vs total turnover
Total turnover in options is a notional figure; premium turnover is the money actually paid for options. Comparing Prem T/O with Opt T/O and Fut T/O helps show whether activity in a name is mostly in futures or in options - two different kinds of participation.
Pairing with OI Spurts
High turnover alone does not say whether positions are new or just changing hands. The OI Spurts tab adds that piece, which is why the two tabs are usually read together.
Strategy ideas (ideas, not promises)
These are ideas to study, paper-trade and backtest, not recommendations or signals, and not a promise of any result. Turnover shows where the market is focused, not which way it will move. Size, entries, exits and risk are your own decisions.
1. Find names with an options-led story
- Setup: a stock high on Most Active Underlying with Opt T/O far above Fut T/O.
- Idea: look for the scheduled event behind it before trading, and read the option chain for the strikes involved.
2. Turnover plus new open interest
- Setup: a name that is high on turnover and also on OI Spurts.
- Reading: activity that is opening new positions; the OI Buildup page then shows their direction.
- Invalidation: high turnover with little OI change: positions mostly changing hands.
3. Do not read a far strike as a forecast
- Reading: heavy turnover in a far out-of-the-money strike is often a hedge or a specific position, not a directional call by the market.
How to test these
Most Active Contracts is live only. Most Active Underlying and OI Spurts can be compared across past sessions to see which flagged names went on to move.
Where to go next
Continue to OI spurts or return to the derivatives data guide. Try Derivatives Activity free.
How to Read This Data
The derivatives activity screen lists the most traded contracts and underlyings, and the contracts with the sharpest change in open interest (OI spurts). It shows where participation in the F&O segment is concentrated on a given day.
- Compare activity by volume with activity by value; cheap far-out-of-the-money options can top the volume list.
- Note whether an OI spurt came with a large price change in the underlying.
- Check nearby strikes and expiries to see whether the activity was isolated.
- Compare with previous sessions to see whether the activity is unusual for that contract.
Limitations: High activity can come from hedging, closing positions, rollovers or spreads. It does not show direction or intent.
More from the blog
- Strategy Backtesting on Unfluke
Backtest trading strategies on real Indian market data with Unfluke. Test equity, Nifty, Bank Nifty and options strategies with realistic costs and key metrics.
- Live Market Scanners
Explore Unfluke's real-time stock scanner for NSE markets. Scan 1,800+ stocks with 40+ technical indicators, fundamental filters, F&O data and custom rules.
- Option Strategy Simulator
Build and simulate multi-leg options strategies with Unfluke. Visualize payoffs, Greeks, max profit and loss, and replay historical option data from 2023.