Market Terminal
OI Spurts: Spotting Unusual Open Interest Changes
7 min read · Updated 2 Nov 2026
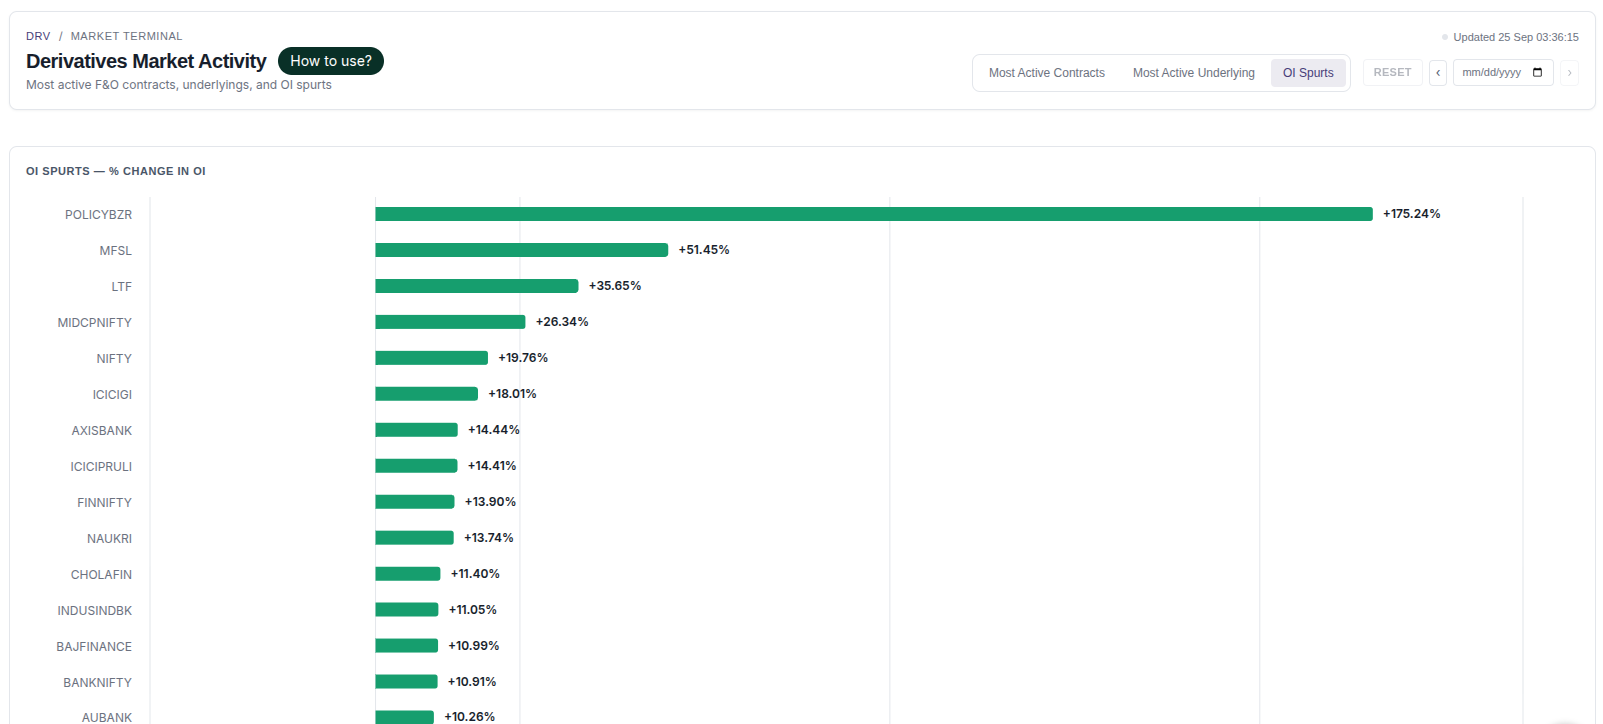
An OI spurt is a sharp jump in a contract's open interest compared with its previous and average level. The Derivatives Activity page's OI Spurts tab ranks contracts by that change.
Here is how the metric works and how it is usually read.
Why the change matters more than raw OI
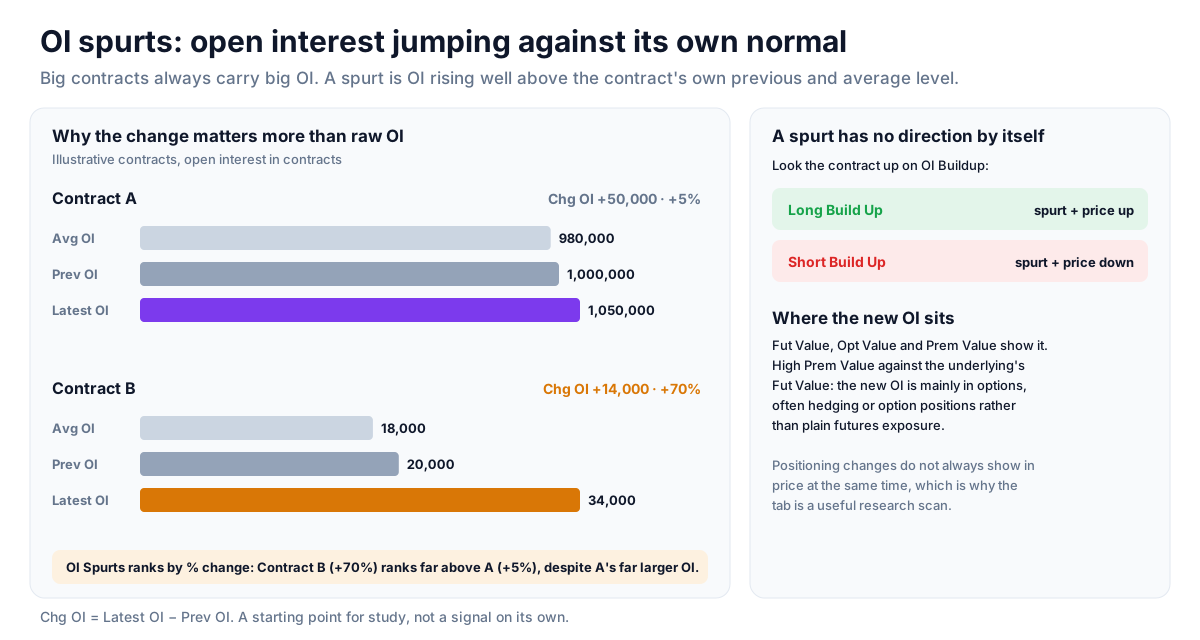
Heavily traded contracts always carry large OI, so a big OI number alone is not unusual. What stands out is OI rising well above a contract's own previous and average level. The tab shows Latest OI, Prev OI, Chg OI and Avg OI side by side, and the chart ranks contracts by the percentage change.
Adding direction from price
An OI spurt has no direction by itself. Looking up the same contract on the OI Buildup page shows whether the new positions coincided with rising price (long buildup) or falling price (short buildup). A spurt that also appears in a clear buildup category gives a more complete picture.
Using it as a research scan
Changes in positioning do not always show up in price at the same time. Looking through OI Spurts for names you do not normally follow is a quick way to find activity worth reading about further. It is a starting point for study, not a signal on its own.
Strategy ideas (ideas, not promises)
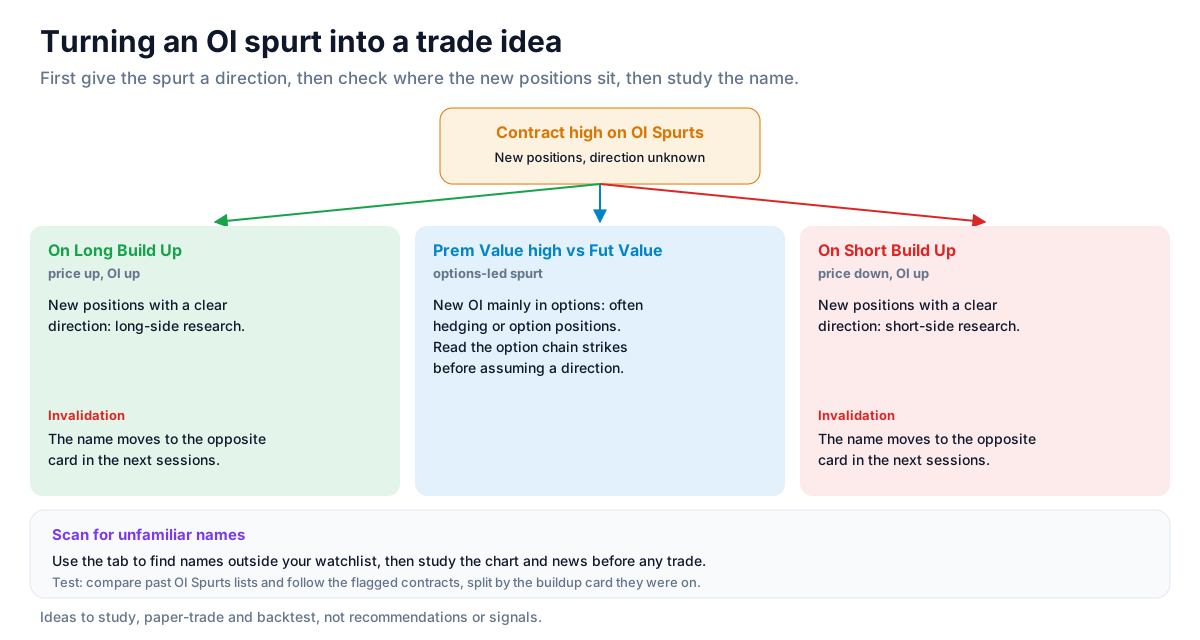
These are ideas to study, paper-trade and backtest, not recommendations or signals, and not a promise of any result. An OI spurt has no direction on its own. Size, entries, exits and risk are your own decisions.
1. Give a spurt its direction
- Setup: a contract high on OI Spurts that also appears on Long Build Up or Short Build Up.
- Reading: new positions with a clear direction: long research on Long Build Up, short research on Short Build Up.
- Invalidation: the name moving to the opposite card in the next sessions.
2. Options-led spurts
- Setup: a spurt where Prem Value is high against Fut Value.
- Reading: new open interest mainly in options, often hedging or option positions; read the option chain for the strikes before assuming direction.
3. A scan for unfamiliar names
- Idea: use the tab to find names outside your watchlist, then study the chart and news before any trade.
How to test these
Compare the OI Spurts list across past sessions and follow what the flagged contracts did over the next few days, split by the buildup card they were on.
Where to go next
Return to most active contracts or the derivatives data guide. Try the OI Spurts tab free.
How to Read This Data
The derivatives activity screen lists the most traded contracts and underlyings, and the contracts with the sharpest change in open interest (OI spurts). It shows where participation in the F&O segment is concentrated on a given day.
- Compare activity by volume with activity by value; cheap far-out-of-the-money options can top the volume list.
- Note whether an OI spurt came with a large price change in the underlying.
- Check nearby strikes and expiries to see whether the activity was isolated.
- Compare with previous sessions to see whether the activity is unusual for that contract.
Limitations: High activity can come from hedging, closing positions, rollovers or spreads. It does not show direction or intent.
More from the blog
- Strategy Backtesting on Unfluke
Backtest trading strategies on real Indian market data with Unfluke. Test equity, Nifty, Bank Nifty and options strategies with realistic costs and key metrics.
- Live Market Scanners
Explore Unfluke's real-time stock scanner for NSE markets. Scan 1,800+ stocks with 40+ technical indicators, fundamental filters, F&O data and custom rules.
- Option Strategy Simulator
Build and simulate multi-leg options strategies with Unfluke. Visualize payoffs, Greeks, max profit and loss, and replay historical option data from 2023.