Market Terminal
Quarterly Results Filings: Audited vs Unaudited, Consolidated vs Standalone
8 min read · Updated 2 Nov 2026
The Filings page lists the quarterly financial results companies have actually submitted to the exchange since 2017, with the quarter, financial year, whether the numbers are audited, and whether they are consolidated or standalone.
This guide explains each column and why those labels matter before comparing any results.
What is a results filing?
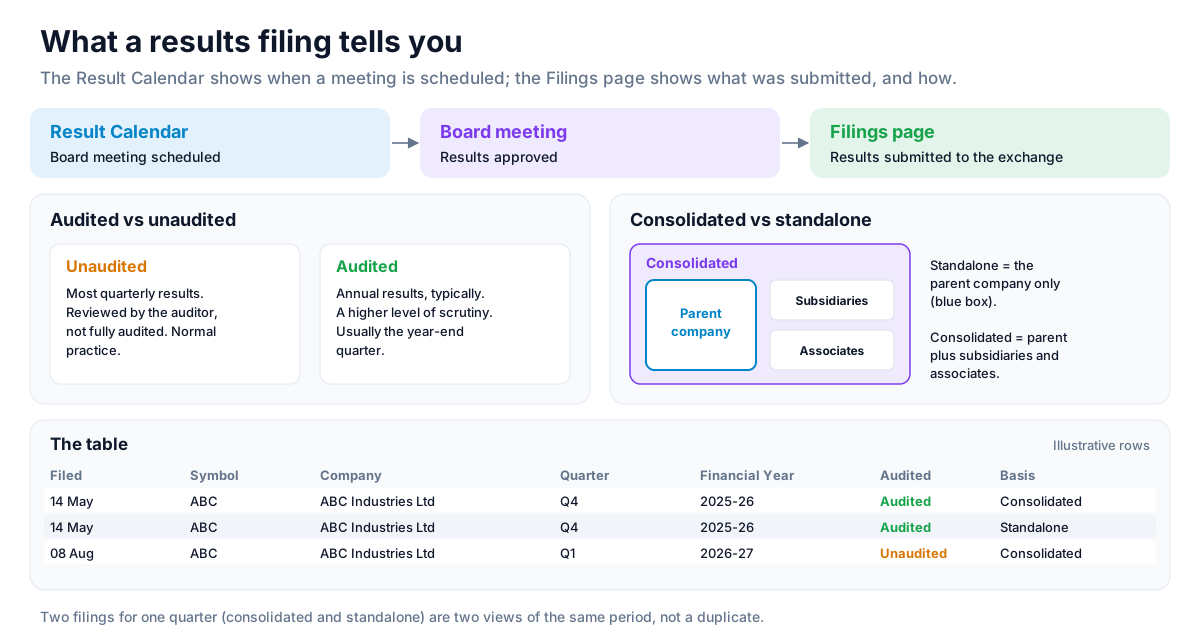
After a board approves results, the company files them with the exchange. The Result Calendar shows when meetings are scheduled; the Filings page shows what was actually submitted and how it was prepared.
How to read it
- Year selector and date picker - browse a whole calendar year, or pick a single date.
- Search box - filter by symbol or company name.
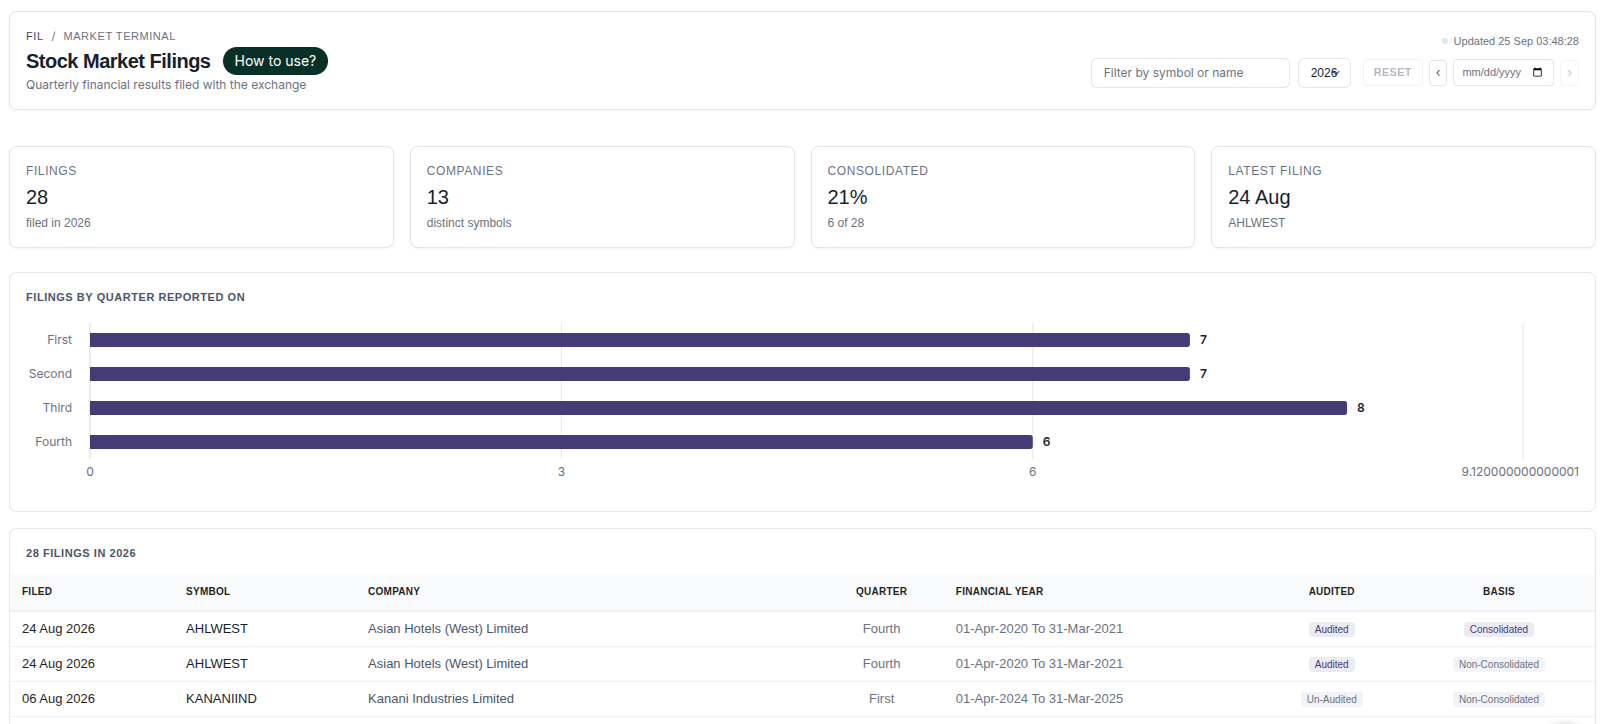
- Filings - number of filings in the period; Companies - distinct symbols; Consolidated - share of filings on a consolidated basis; Latest Filing - the most recent one.
- Filings by quarter chart - how many filings relate to each quarter being reported.
- Table - Filed (date submitted), Symbol, Company, Quarter, Financial Year, Audited and Basis (consolidated or standalone).
Using the page for research
- Search for a company and check its filings over several quarters.
- Before comparing two periods, confirm both use the same basis.
- Note whether a result is audited, especially around the year-end quarter.
- Compare the Filed date with the company's scheduled meeting on the Result Calendar.
Audited vs unaudited
Most quarterly results are unaudited - reviewed by the auditor but not fully audited - which is normal practice. Annual results are typically audited and carry a higher level of scrutiny. The Audited column shows which is which, so filings are not all treated as equally verified.
Consolidated vs standalone
A consolidated result includes subsidiaries and associates; a standalone result covers only the parent company. Comparing a consolidated number with a standalone one - across quarters or across companies - can give a misleading picture. The Basis column makes the difference visible.
Strategy ideas (ideas, not promises)
These are ideas to study, paper-trade and backtest, not recommendations or signals, and not a promise of any result. A filing describes reported numbers; the market may have priced them in already. Size, entries, exits and risk are your own decisions.
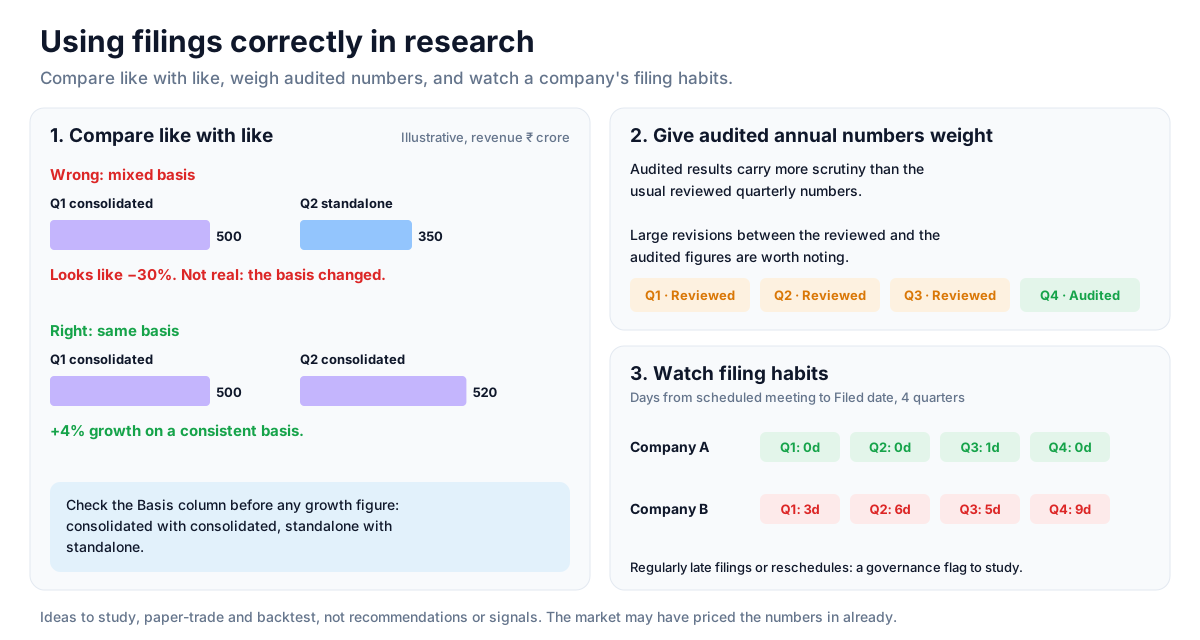
1. Compare like with like
- Setup: a company's filings over several quarters on the Filings page.
- Reading: check the Basis column and compare consolidated with consolidated, standalone with standalone.
- Invalidation: a growth figure built by comparing a consolidated quarter with a standalone one is not real growth.
2. Give audited annual numbers more weight
- Setup: the Audited column around the year-end quarter.
- Reading: audited results carry more scrutiny than the usual reviewed quarterly numbers; large revisions between the two are worth noting.
3. Watch filing habits
- Setup: compare the Filed date with the scheduled meeting on the Result Calendar over several quarters.
- Reading: a company that regularly files late or reschedules meetings is a governance flag to study further.
How to test these
For a few companies, list several years of filings, check that the basis is consistent across the quarters you compare, and see how the stock moved around each filing date on the Historical Charts.
Where to go next
Return to how to read the results calendar or the reference data guide. Try the Filings page free.
How to Read This Data
Company filings are the official documents listed companies submit to the exchange — quarterly results, announcements, shareholding and more. Reading them is the basis of fundamental research into a business's revenue, profit, debt and ownership.
- Compare a quarter's figures with the same quarter last year as well as the previous quarter.
- Look at revenue, operating profit and net profit together; they can move differently.
- Note changes in debt, cash flow, promoter holding and auditor comments where disclosed.
- Read the full filing, not only the headline numbers.
Limitations: Filings report past periods and can be revised. Interpreting them requires care, and the information is public to all market participants at the same time.
More from the blog
- Strategy Backtesting on Unfluke
Backtest trading strategies on real Indian market data with Unfluke. Test equity, Nifty, Bank Nifty and options strategies with realistic costs and key metrics.
- Live Market Scanners
Explore Unfluke's real-time stock scanner for NSE markets. Scan 1,800+ stocks with 40+ technical indicators, fundamental filters, F&O data and custom rules.
- Option Strategy Simulator
Build and simulate multi-leg options strategies with Unfluke. Visualize payoffs, Greeks, max profit and loss, and replay historical option data from 2023.