Market Terminal
Nifty 50 Heatmap: How to Read It and Study Sector Rotation
9 min read · Updated 2 Nov 2026
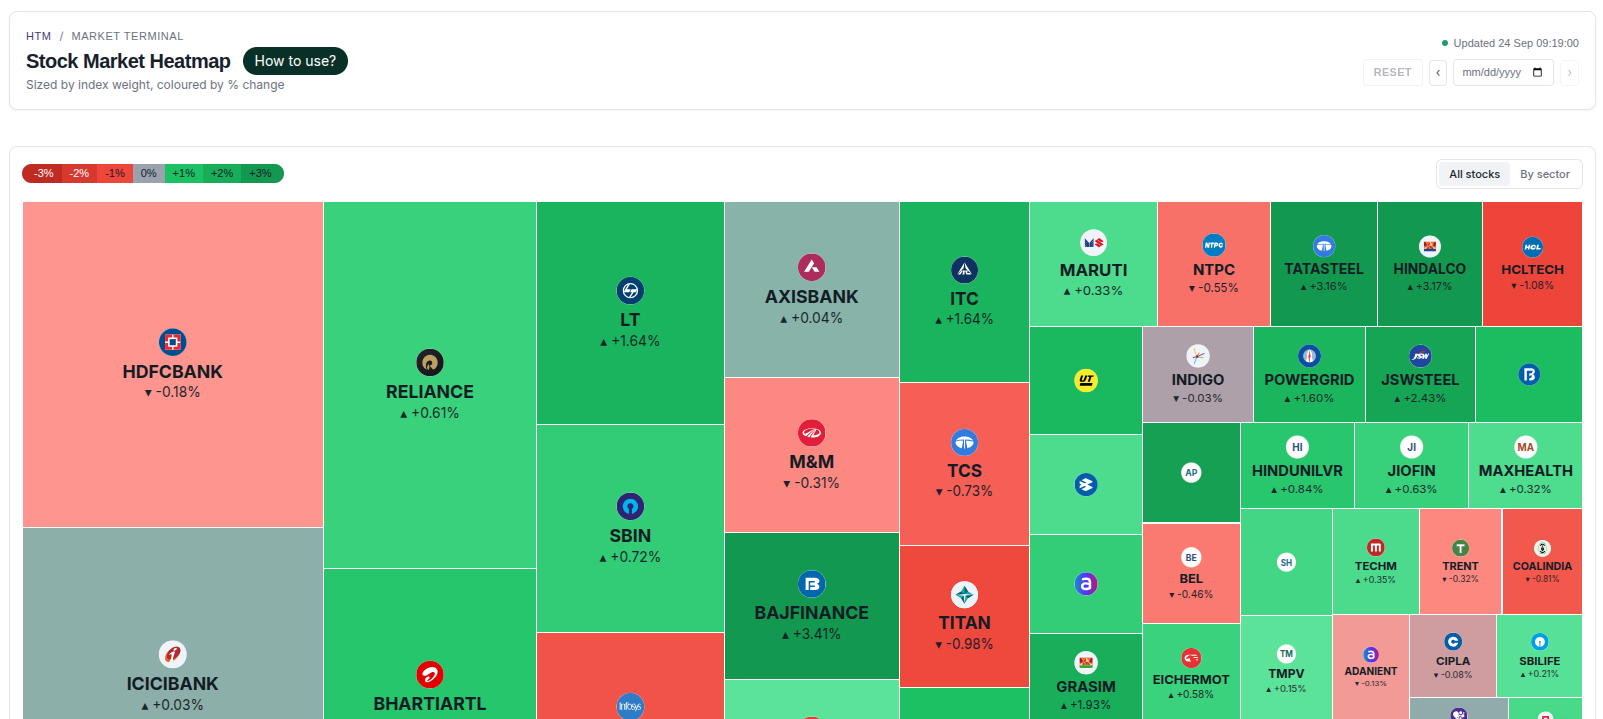
The Heatmap page shows every Nifty 50 stock as a tile, sized by its index weight and coloured by the day's % change, with an optional grouping by sector.
This guide explains how to read the tiles, how to use the sector view, and how analysts commonly use the heatmap to study sector rotation.
What is a market heatmap?
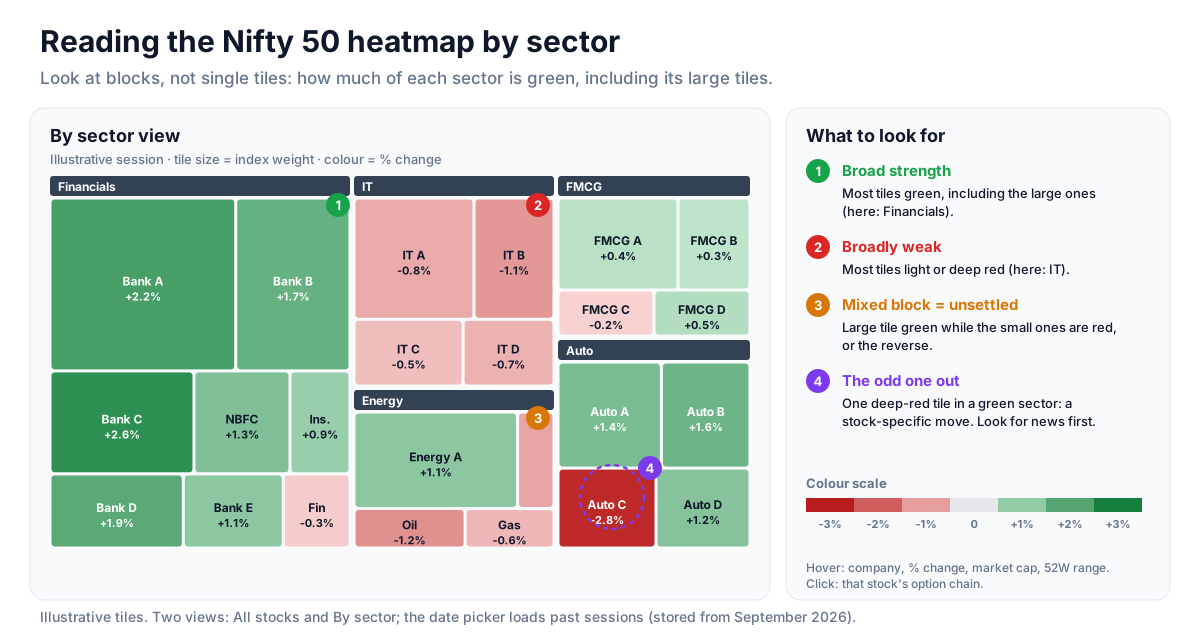
A market heatmap is a colour-coded picture of an index. Instead of reading fifty rows of numbers, you see the whole index at once: green where stocks are up, red where they are down, with the strength of the colour showing the size of the move.
Unfluke's Nifty 50 heatmap has two views - All stocks and By sector - and a date picker for past sessions (stored from September 2026).
How to read it
- Each tile is one Nifty 50 constituent.
- Tile size is the stock's free-float weight in the index, so bigger tiles move the Nifty more.
- Tile colour is the day's % change on a red-to-green scale; the legend runs from −3% to +3%, and deeper colour means a bigger move.
- By sector groups tiles into labelled sector blocks; All stocks shows one flat map.
- Hover a tile to see the company, % change, market cap and 52-week range.
- Click a tile to open that stock's option chain.
Reading the sector view
Switch to By sector and look at blocks, not single tiles. A sector where most tiles are green - including its larger tiles - is showing broad strength. A mixed block, with large tiles green and small tiles red or the other way round, is unsettled. For the detail behind tile size, see why tile size matters.
Concept: sector rotation
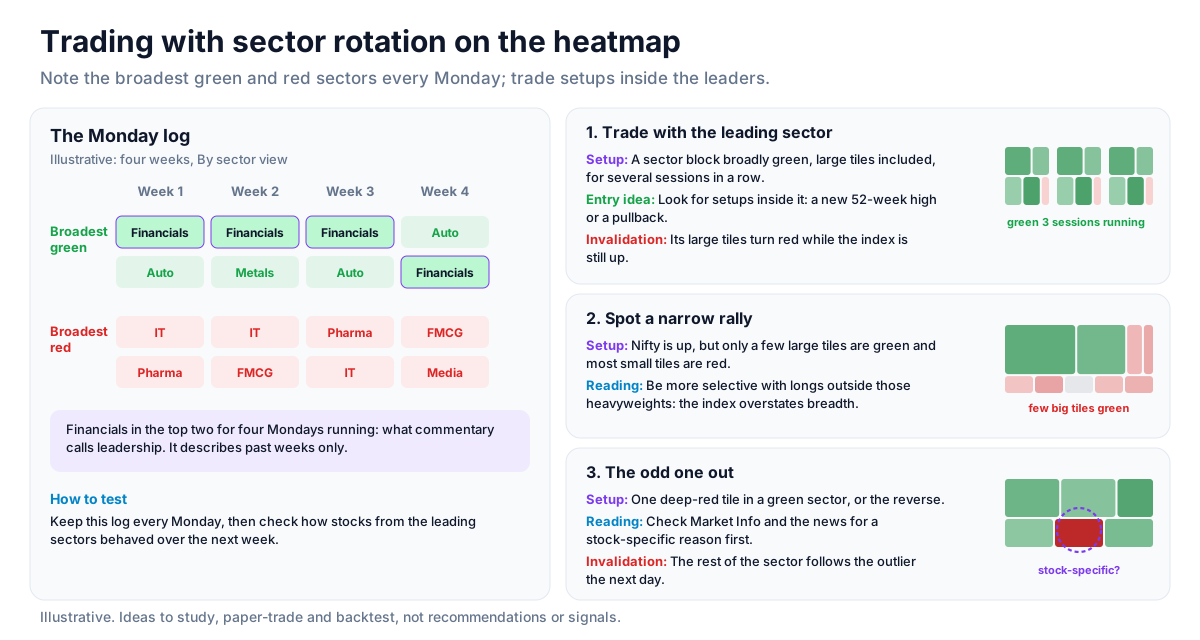
Money rotates between sectors even on days the index is flat. One way analysts track this is to note, at the start of each week, which two sectors show the broadest green and which two show the broadest red, and to watch how that list changes over several weeks. A sector that stays near the top for several weeks running is what market commentary calls leadership; it describes the past weeks and says nothing certain about the next one.
Confirming the picture with Indices
The Indices page ranks every NSE sector index by % change. When, say, banking tiles are broadly green on the heatmap and Nifty Bank also ranks near the top on Indices, two independent views agree. See reading relative strength on the Indices page. The heatmap's date picker also makes it easy to check whether a sector was strengthening on previous sessions too.
Strategy ideas (ideas, not promises)
These are ideas to study, paper-trade and backtest, not recommendations or signals, and not a promise of any result. Sector leadership describes recent sessions and can change at any time. Size, entries, exits and risk are your own decisions.
1. Trade with the leading sector
- Setup: A sector block that is broadly green, including its large tiles, for several sessions in a row (use the date picker).
- Entry idea: Look for individual setups, such as a new 52-week high or a pullback, inside that sector rather than in weak ones.
- Invalidation: The sector's large tiles turning red while the index is still up.
2. Spot a narrow rally
- Setup: The Nifty is up, but only a few large tiles are green and most small tiles are red.
- Reading: Be more selective with long ideas outside those heavyweights; the index number overstates the market's breadth.
3. The odd one out
- Setup: One deep-red tile inside an otherwise green sector, or the reverse.
- Reading: Check Market Info and the news for a stock-specific reason before treating it as a sector signal.
- Invalidation: The rest of the sector following the outlier the next day.
How to test these
Each Monday, write down the two broadest green and two broadest red sectors from the By sector view and compare the list week to week. Then check how stocks from the leading sectors behaved over the next week.
Where to go next
Read why tile size matters next, or explore the full equity data guide. Try the Heatmap free.
How to Read This Data
A heatmap shows market breadth at a glance: tile size reflects a stock's weight in the index and colour reflects its change. It helps answer whether a move in the index came from a few heavyweights or from many stocks moving together.
- Look for colour clusters by sector to see whether strength or weakness was broad or isolated.
- Compare the largest tiles with the index change; heavyweights can move the index even when most stocks move the other way.
- Compare several sessions to see whether the same sectors keep leading or leadership rotates.
- Read tile size and colour together: a large red tile matters more to the index than a small green one.
Limitations: A heatmap is a snapshot of one period. It shows where the change happened, not what caused it or whether the pattern will persist.
More from the blog
- Strategy Backtesting on Unfluke
Backtest trading strategies on real Indian market data with Unfluke. Test equity, Nifty, Bank Nifty and options strategies with realistic costs and key metrics.
- Live Market Scanners
Explore Unfluke's real-time stock scanner for NSE markets. Scan 1,800+ stocks with 40+ technical indicators, fundamental filters, F&O data and custom rules.
- Option Strategy Simulator
Build and simulate multi-leg options strategies with Unfluke. Visualize payoffs, Greeks, max profit and loss, and replay historical option data from 2023.