Market Terminal
Using Short-Selling Data to Read Bearish Sentiment
7 min read · Updated 2 Nov 2026
NSE's short-selling disclosure is unusual: no price and no client - only date, name, symbol and quantity. The Short Selling tab on the Large Deals page turns that narrow dataset into a most-short-sold chart plus total quantity and securities count.
Why quantity alone still matters
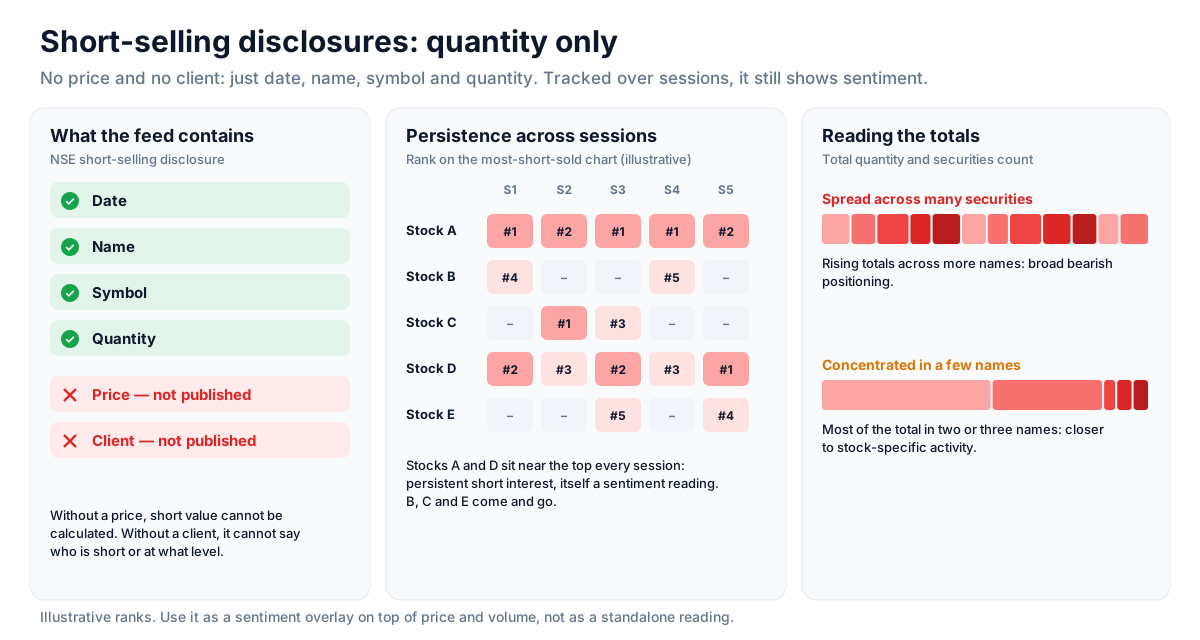
Without a price, short value cannot be calculated - but quantity tracked across sessions still shows where bearish positioning is concentrating. A stock near the top of the most-short-sold chart for several days running is attracting persistent short interest, which is itself a sentiment reading.
Adding price back in
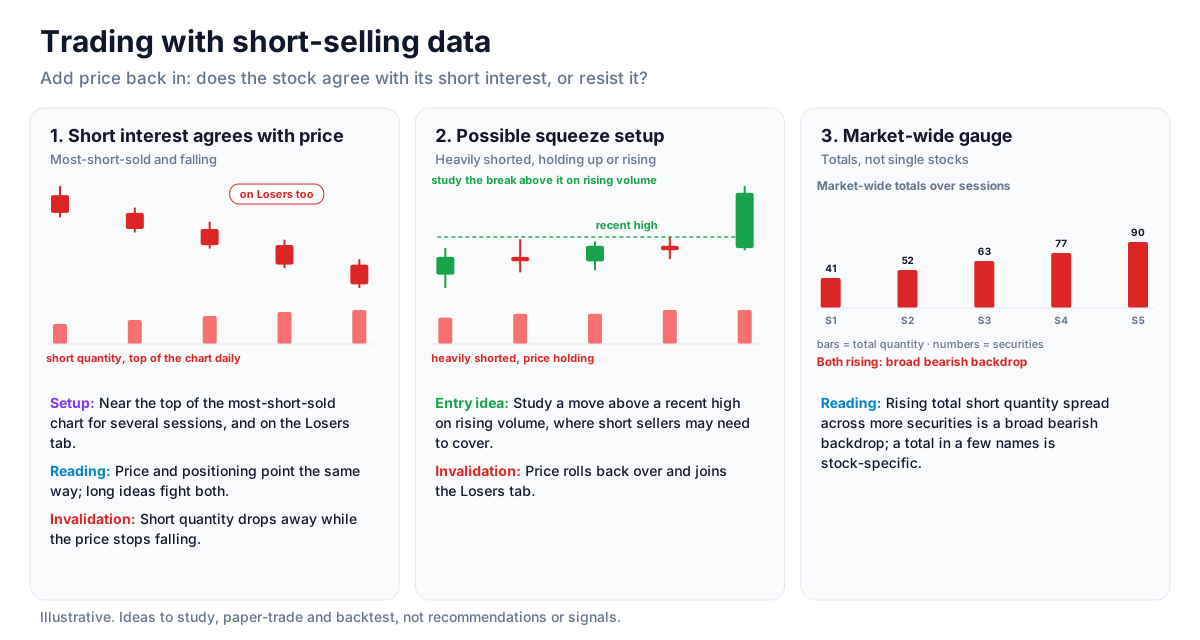
Comparing the most-short-sold names with the same day's Losers tab adds the missing dimension. A heavily shorted stock that is already falling shows price agreeing with the short interest. A heavily shorted stock that is holding up or rising is the situation analysts associate with possible short squeezes.
Reading the totals
Total quantity short-sold and the number of securities give a market-wide gauge independent of any single stock. Rising totals spread across more securities suggest broad bearish positioning; a total concentrated in a few names is closer to stock-specific activity.
Know the data's limits
With no price or client attached, this data cannot say who is shorting or at what level. It works best as a sentiment overlay on top of price and volume data elsewhere in the terminal, not as a standalone reading.
Strategy ideas (ideas, not promises)
These are ideas to study, paper-trade and backtest, not recommendations or signals, and not a promise of any result. Short-sale disclosures carry no price or client, so they say nothing about who is short or at what level. Size, entries, exits and risk are your own decisions.
1. Short interest agreeing with price
- Setup: A stock near the top of the most-short-sold chart for several sessions that is also on the Losers tab.
- Reading: Price and positioning point the same way; long ideas in it fight both.
- Invalidation: Short quantity dropping away while the price stops falling.
2. Possible squeeze setup
- Setup: A heavily shorted stock that is holding up or rising.
- Entry idea: Study a move above a recent high on rising volume, where short sellers may need to cover.
- Invalidation: The price rolling back over and joining the Losers tab.
3. Market-wide gauge
Rising total short quantity spread across more securities is a broad bearish backdrop; a total concentrated in a few names is stock-specific.
How to test these
Track the most-short-sold names across past sessions and note how many fell further and how many rose against the short interest over the next week.
Where to go next
Pair this with how to read bulk and block deals. Explore short-selling data free.
How to Read This Data
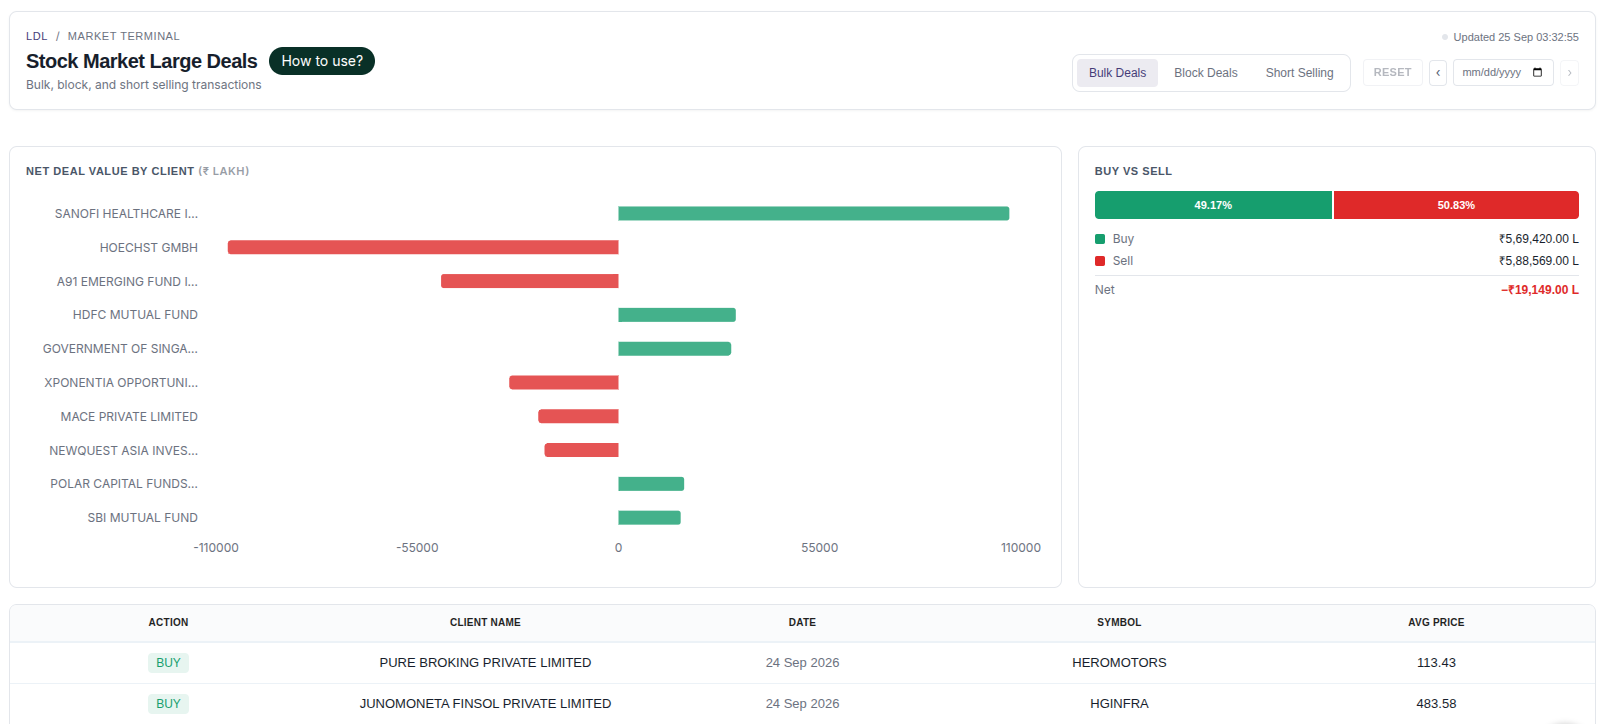
Bulk and block deals are large transactions that exchanges must disclose, with the client name, quantity and price. Analysts study them to understand who is transacting in size, and whether the price was at a discount or premium to the market.
- Compare the deal price with the stock's closing price to see whether it was struck at a discount or premium.
- Compare the deal quantity with the stock's average daily volume to judge how large it really was.
- Note whether the same client appears repeatedly across sessions.
- Read short-selling disclosures alongside deals to see both sides of the activity.
Limitations: Disclosures show a transaction, not the reason behind it. A deal can be a portfolio rebalance, a promoter transfer or a hedge, and it says nothing about the client's future actions.
More from the blog
- Strategy Backtesting on Unfluke
Backtest trading strategies on real Indian market data with Unfluke. Test equity, Nifty, Bank Nifty and options strategies with realistic costs and key metrics.
- Live Market Scanners
Explore Unfluke's real-time stock scanner for NSE markets. Scan 1,800+ stocks with 40+ technical indicators, fundamental filters, F&O data and custom rules.
- Option Strategy Simulator
Build and simulate multi-leg options strategies with Unfluke. Visualize payoffs, Greeks, max profit and loss, and replay historical option data from 2023.