Market Terminal
Bulk and Block Deals Today: How to Read Them
10 min read · Updated 2 Nov 2026
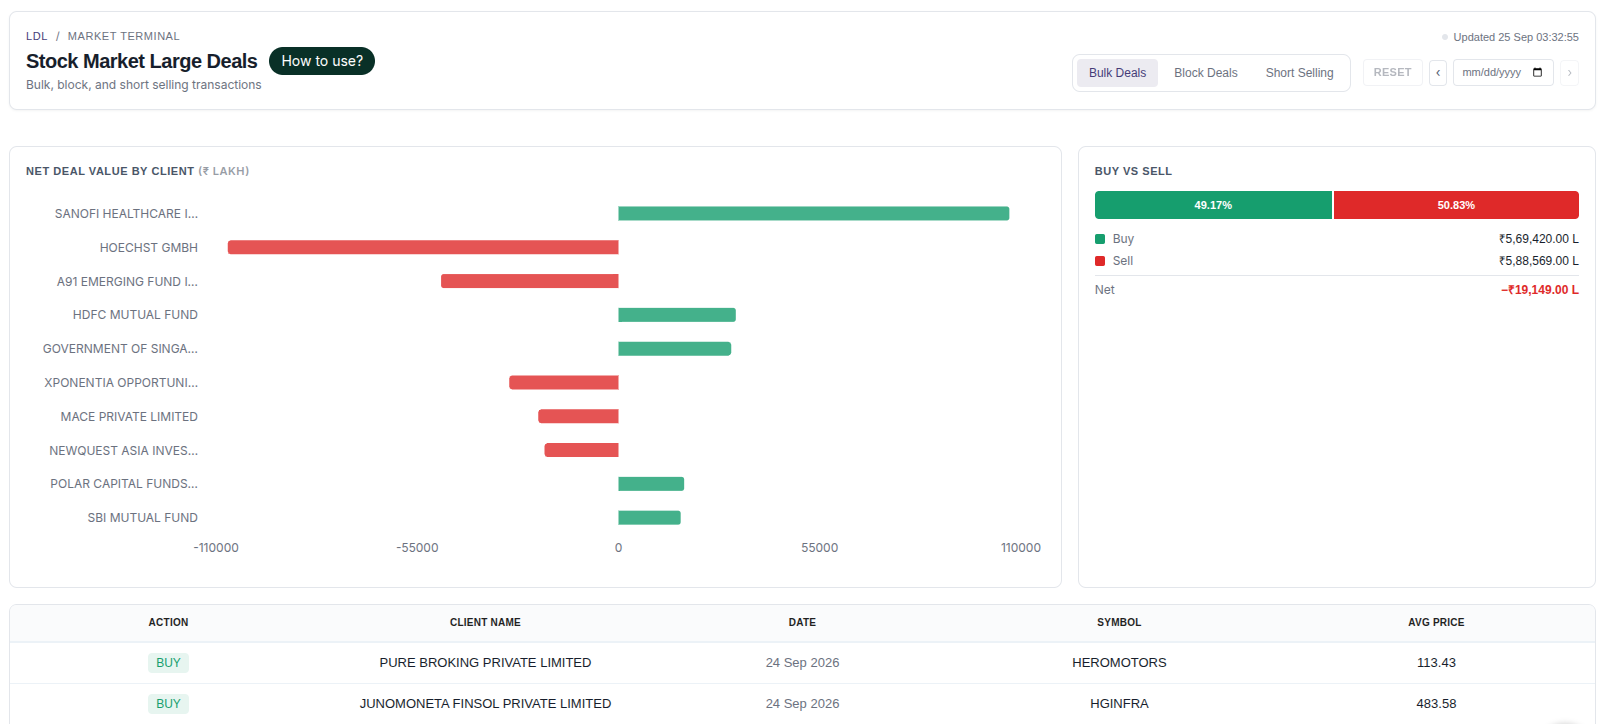
The Large Deals page shows NSE bulk deals, block deals and short-selling disclosures, with charts of net deal value by client and the buy-versus-sell split.
This guide explains the difference between the deal types, how to read each panel, and what named-client data can and cannot tell you.
What are bulk and block deals?
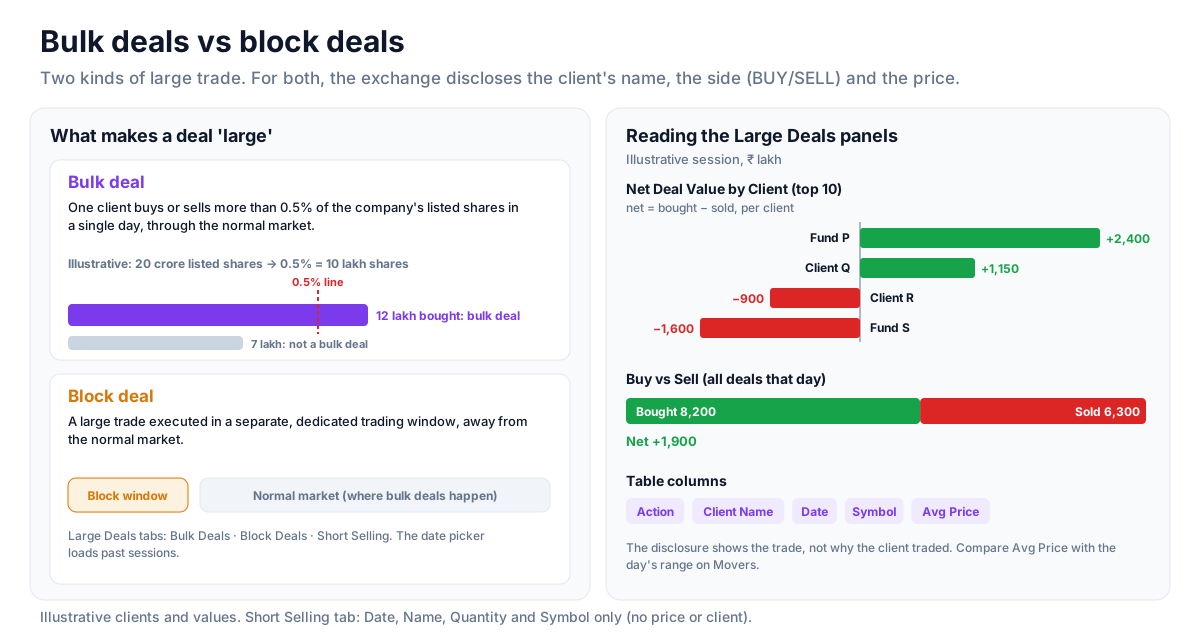
A bulk deal is a trade in which one client buys or sells more than 0.5% of a company's listed shares in a single day, through the normal market. A block deal is a large trade executed in a separate, dedicated trading window. In both cases the exchange discloses the client's name, the side and the price.
The Large Deals page has three tabs: Bulk Deals, Block Deals and Short Selling. A date picker loads past sessions.
How to read it
- Net Deal Value by Client - the ten clients with the largest net (buy minus sell) deal value, in ₹ lakh.
- Buy vs Sell - total bought against total sold, with the net figure.
- Action - BUY or SELL.
- Client Name - the disclosed buyer or seller.
- Date, Symbol, Avg Price - when, which stock, and the average price of the deal.
- Short Selling tab - Date, Name, Quantity and Symbol only (NSE publishes no price or client for this feed), with a most-short-sold chart and total quantity.
Reading the panels together
Rather than reading disclosures one at a time, start with the charts: they show who has been the largest net buyer or seller and in which names. Then use the table to check the average price against the stock's range that day on the Movers page. A deal well below the market price often reflects a negotiated stake transfer rather than fresh buying at market. The disclosure does not say why the client traded.
Concept: repeat clients
A single large deal from an unfamiliar client says little - it may be a one-off rebalance. A client appearing again and again as a net buyer in the same stock or sector across several sessions is a pattern analysts describe in much more detail. Tracking the Net Deal Value chart over a week or two is the simplest way to see it; the client tracking article goes deeper.
Concept: follow-through
Deal data is easier to interpret alongside what the market did afterwards. A stock bought in bulk that then shows price and volume follow-through on the Volume Gainers tab tells a different story from one that shows no reaction at all.
Strategy ideas (ideas, not promises)
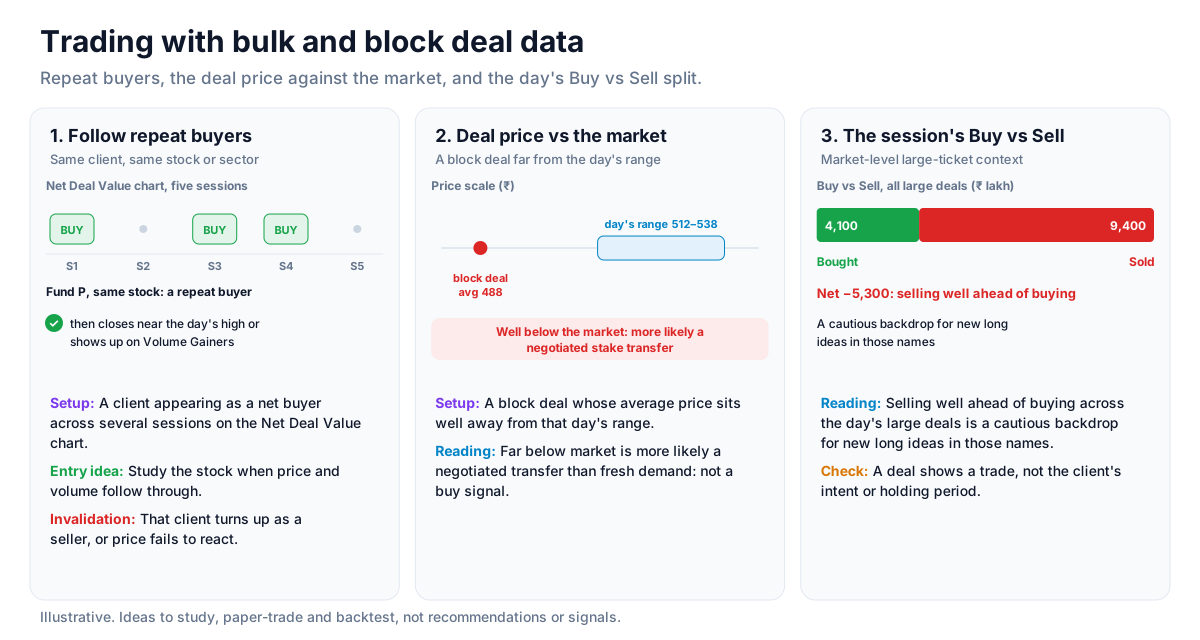
These are ideas to study, paper-trade and backtest, not recommendations or signals, and not a promise of any result. A deal shows a trade, not the client's intent or holding period. Size, entries, exits and risk are your own decisions.
1. Follow repeat buyers
- Setup: The same client appearing as a net buyer in a stock (or its sector) across several sessions on the Net Deal Value chart.
- Entry idea: Study the stock when price and volume follow through, for example a close near the day's high or an appearance on Volume Gainers.
- Invalidation: That client turning up as a seller, or the price failing to react to the buying.
2. Read the deal price against the market
- Setup: A block deal whose average price sits well away from the stock's range that day.
- Reading: A deal far below market is more likely a negotiated transfer than fresh demand; do not read it as a buy signal.
3. Use the session's Buy vs Sell split
Selling well ahead of buying across the day's large deals is a cautious backdrop for new long ideas in those names.
How to test these
Keep a simple log of client, stock, side and date from past sessions, then check how the stocks with repeat net buyers moved over the following weeks compared with one-off deals.
Where to go next
How to Read This Data
Bulk and block deals are large transactions that exchanges must disclose, with the client name, quantity and price. Analysts study them to understand who is transacting in size, and whether the price was at a discount or premium to the market.
- Compare the deal price with the stock's closing price to see whether it was struck at a discount or premium.
- Compare the deal quantity with the stock's average daily volume to judge how large it really was.
- Note whether the same client appears repeatedly across sessions.
- Read short-selling disclosures alongside deals to see both sides of the activity.
Limitations: Disclosures show a transaction, not the reason behind it. A deal can be a portfolio rebalance, a promoter transfer or a hedge, and it says nothing about the client's future actions.
More from the blog
- Strategy Backtesting on Unfluke
Backtest trading strategies on real Indian market data with Unfluke. Test equity, Nifty, Bank Nifty and options strategies with realistic costs and key metrics.
- Live Market Scanners
Explore Unfluke's real-time stock scanner for NSE markets. Scan 1,800+ stocks with 40+ technical indicators, fundamental filters, F&O data and custom rules.
- Option Strategy Simulator
Build and simulate multi-leg options strategies with Unfluke. Visualize payoffs, Greeks, max profit and loss, and replay historical option data from 2023.