Comparison
Stock Scanner vs Manual Analysis - Which is Better?
10 min read · Updated 2 Nov 2026
There's a quiet argument among retail traders: "scanners are crutches - real traders read charts" versus "manual analysis at scale is insane in 2026, scan or get left behind". Both camps are wrong by themselves. The truthful answer is that scanners and manual analysis do different jobs, and the trader who uses both ends up ahead of the trader who treats them as a choice.
This piece breaks down where each wins, where each fails, and how to combine them into a workflow that actually works.
What each is, really
Stock scanner: a piece of software that evaluates a defined rule against the entire NSE universe and returns the matches in seconds. Examples: "all stocks where RSI(14) crossed above 60 today and close > VWAP". The scanner doesn't decide whether the setup is good - it finds every name that matches what you told it to look for.
Manual analysis: a human reading charts, news, filings, and order flow to form a judgment about a specific stock. Slower, narrower, but informed by context a scanner can't encode.
Side-by-side comparison
| Dimension | Stock Scanner | Manual Analysis |
|---|---|---|
| Speed across universe | Full NSE in seconds | 3-10 minutes per chart |
| Consistency | Perfectly consistent | Mood-dependent, bias-prone |
| Captures context | Only what's in the rule | News, structure, why it's moving |
| Catches edge cases | Misses what isn't in the rule | Catches surprising setups |
| Cost of running daily | Seconds per scan | Hours per session |
| Skill required | Define a rule once | Continuous learning |
| Scales to portfolio | Yes | No |
When the scanner wins outright
Any time you need to filter the entire market for a specific, objective setup. "Stocks where 50 EMA crossed above 200 EMA and volume is 2x average" is a perfect scanner job. A human can't read 1,800 charts in a session - and even if they could, they wouldn't do it consistently. The scanner does it the same way every time. For systematic setups across the full universe, scanners are non-negotiable.
When manual analysis wins
When context matters more than the pattern. A stock that breaks out on news about a regulatory ruling, or a sector rotation triggered by a budget announcement, is a story a scanner cannot understand. Manual analysis catches the why behind a move, which often determines whether the move is real or noise. For specific name-by-name conviction work - earnings analysis, event-driven plays, fundamental theses - manual work is irreplaceable.
Where both approaches fail
Scanners fail when:
- The setup that matters isn't expressible as a rule (yet)
- The scanner over-fires and you can't tell signal from noise
- The trader treats every scanner hit as a buy
Manual analysis fails when:
- The trader's attention is uneven (you analyse stocks you already like and ignore others)
- Bias takes over (confirmation bias, anchoring, recency)
- Time runs out before you've covered enough names
The hybrid workflow most pros actually use
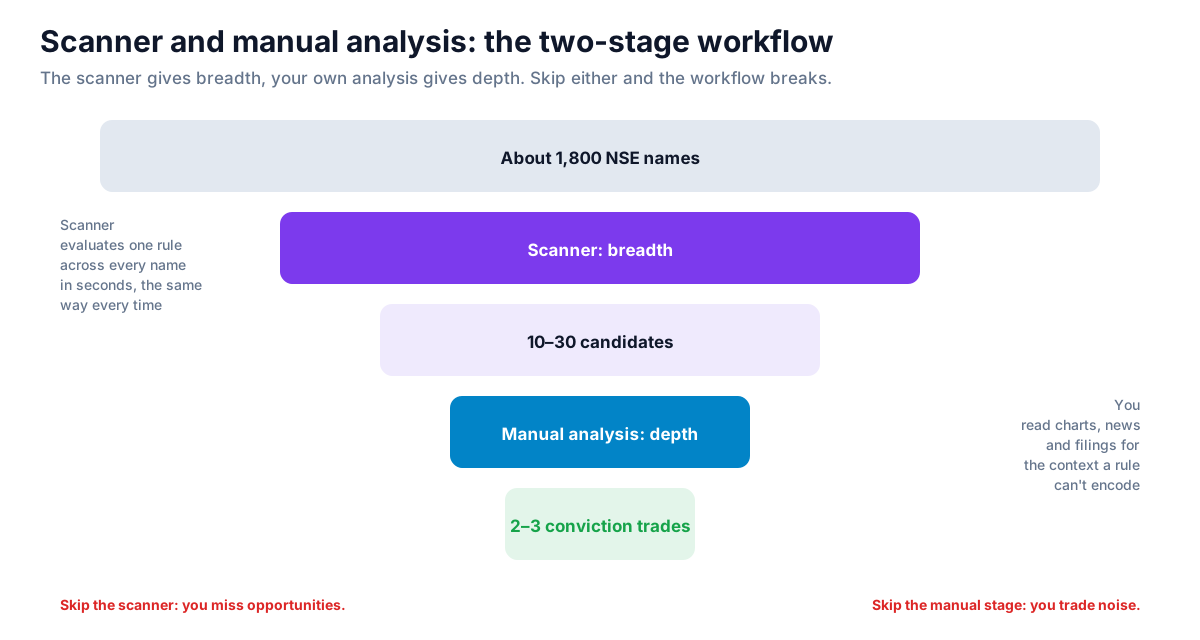
In practice, every disciplined retail trader runs a two-stage workflow. The scanner does breadth - narrows 1,800 names to 10-30 candidates. Manual analysis does depth - turns those 10-30 into 2-3 conviction trades. Skipping either stage is where most retail workflows break. Skipping the scanner means you miss opportunities; skipping the manual stage means you trade noise.
The ROI math
If you spend 90 minutes a day on manual chart review and a scanner replaces 60 of those minutes (cutting the universe down before you start), that's 300 minutes a week back. Use those for deeper analysis on your top candidates, or for fundamental research, or for journal review. The ROI of a scanner isn't "more trades" - it's "better-quality decisions on fewer trades, with the same time budget".
Strategy ideas (ideas, not promises)
These are ideas to study, paper-trade and backtest, not recommendations or signals, and not a promise of any result. Neither a scanner nor your own reading makes a setup work; they only decide what you look at. Size, entries, exits and risk are your own decisions.
1. Run the two-stage workflow
- Setup: let a scan cut the market to 10 to 30 names, then study those by hand.
- Use: the scanner gives breadth; your reading of charts and filings gives depth.
2. Write down why you rejected a name
- Setup: for each scanned stock you pass on, note the reason.
- Reading: a reason that keeps repeating may belong in the scan itself.
3. Check the scan against your picks
- Setup: after a few weeks, compare how the names you chose did against the full scan list.
- Reading: if your picks did no better, the manual stage is not adding much yet.
How to test these
Backtest the scan's rule on Unfluke to see how its matches behaved without your manual filter.
Honest caveats
A scanner is only as good as the rule you give it. Garbage rules produce garbage candidates. The most common retail mistake is to buy a fancy scanner and then write the same RSI rule everyone else uses - getting the same crowded setups. Manual analysis doesn't fix that problem either if your read on a chart is shallow. Tools amplify the judgment you bring to them.
Try Unfluke's scanner
Unfluke's scanner combines technical + fundamental filters with an expression builder, native alerts, and direct export to backtest. Sign up free, or read the full scanner overview and the 10-feature buyer's checklist.
More from the blog
- Strategy Backtesting on Unfluke
Backtest trading strategies on real Indian market data with Unfluke. Test equity, Nifty, Bank Nifty and options strategies with realistic costs and key metrics.
- Live Market Scanners
Explore Unfluke's real-time stock scanner for NSE markets. Scan 1,800+ stocks with 40+ technical indicators, fundamental filters, F&O data and custom rules.
- Option Strategy Simulator
Build and simulate multi-leg options strategies with Unfluke. Visualize payoffs, Greeks, max profit and loss, and replay historical option data from 2023.