Backtesting
Trade Log to Options: Turn Your Spot or Futures Trades into an Options Backtest
12 min read · Updated 9 Nov 2026
Many traders have a system that trades the index or a stock itself: buy NIFTY here, sell it there. A common question is what the same signals would have made in options. Buying calls instead of going long, or selling puts, or a spread? Rebuilding every trade by hand against old option prices is slow and error-prone.
Trade log → Options does it for you. Upload a CSV of your entries and exits on 1-minute spot prices, describe up to four option legs, and the page prices every trade in the real option contracts that were trading at that minute, then shows the result in the same analysis as Unfluke's backtester. This guide covers the file format, each setting, how prices are filled, and how to read the results.
What the converter does
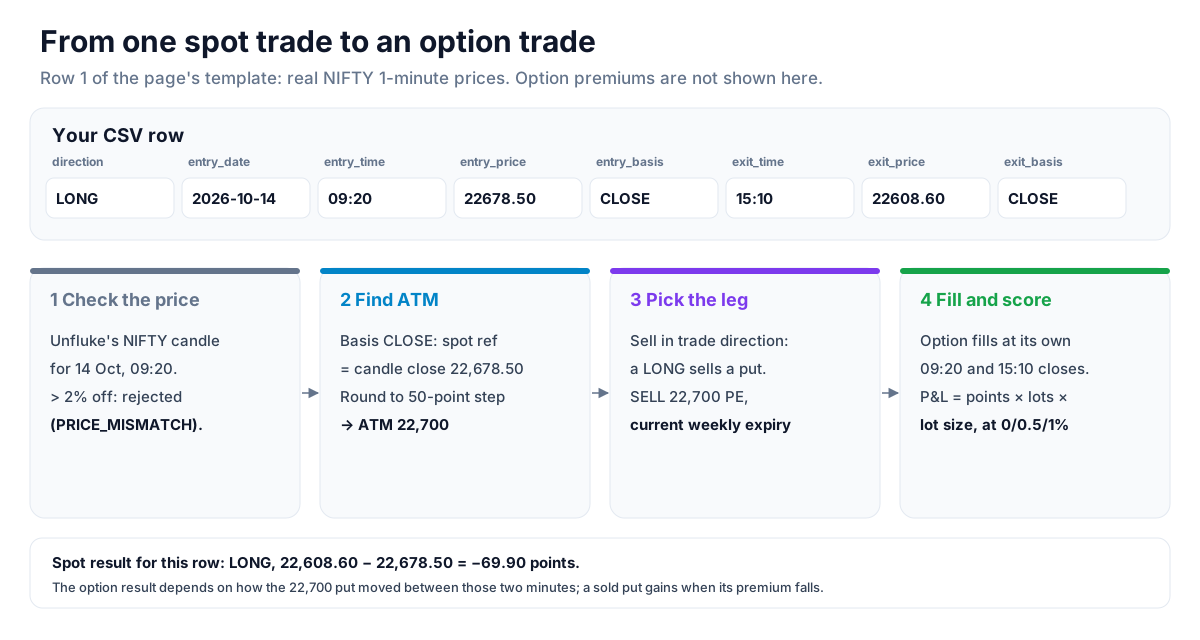
For every row in your file the page:
- Checks your price against Unfluke's own 1-minute candle for that symbol and minute.
- Finds ATM: the strike nearest the spot at your entry minute.
- Picks each leg's contract: call or put, strike, and expiry, from the legs you set up and the trade's direction.
- Fills the option at the entry and exit minutes, at the part of the option candle that matches your fill (open, close, high, low, or a point inside it).
- Works out P&L per leg in points and rupees (points × lots × lot size), at 0%, 0.5% and 1% slippage.
Then it runs the priced trades through the same analysis as Unfluke's backtesters: equity curve, drawdown, monthly and yearly tables, win rate, streaks, and the rest. Next to it, your spot trades' own result in points, for comparison.
What you can convert
- Indices: NIFTY, BANKNIFTY, FINNIFTY, MIDCPNIFTY and NIFTYNXT50. SENSEX is listed but not available yet.
- Every F&O stock, about 220, from a searchable picker. Stocks and NIFTYNXT50 have monthly expiries only.
- Dates: NIFTY option data runs from 2 January 2017 to the latest loaded minute (30 October 2026 when this was written). The page shows the range for the symbol you pick; other symbols' ranges differ.
- India only: on the crypto side the page points you to the Indian market.
Preparing your trade log
The file is a .csv with a header row and one row per trade, at most 5,000 rows and 2 MB. Header names are not case-sensitive, spaces and hyphens count as underscores ("Entry Date" means entry_date), and extra columns are ignored. The "Download template" button gives you a ready-made file.
The columns
- direction (required): LONG or SHORT. BUY, SELL, L and S also work.
- entry_date, exit_date (required): YYYY-MM-DD, DD-MM-YYYY or DD/MM/YYYY.
- entry_time, exit_time (required): HH:MM or HH:MM:SS, IST, 24-hour, from 09:15 to 15:29. Seconds are dropped.
- entry_price, exit_price (required): the spot (index or stock) price you were filled at.
- entry_basis, exit_basis (required): OPEN, CLOSE, HIGH, LOW or LTP, where in the 1-minute candle the fill happened.
- trade_id (optional): your own id, echoed back. Defaults to the row number.
- symbol (optional): if present, it must match the symbol picked on the page.
- lots (optional): a whole-number multiplier on every leg's lots. Default 1.
Times are candle starts
09:20 means the candle from 09:20:00 to 09:20:59. Many platforms label a candle by its end; if yours does, shift your times one minute earlier, or the prices will not match. The exit can be in the same minute as the entry or any later minute, on the same day or a later one.
The basis decides the fill
- OPEN or CLOSE: the option fills at its candle's open or close.
- HIGH: calls fill at the option candle's high, puts at its low, because a put moves against the spot.
- LOW: calls fill at the low, puts at the high.
- LTP: a price somewhere inside the candle. By default the option fills at the same relative position inside its own candle: a spot fill 70% of the way up the spot candle fills a call 70% of the way up its candle, and a put 70% of the way down. You can switch this to "Option candle close" in the settings.
The basis also sets the spot level ATM is worked out from: OPEN, CLOSE, HIGH and LOW use that field of Unfluke's spot candle; LTP uses your price, kept inside the candle's range.
The template's rows
The template holds three NIFTY trades with real 1-minute prices, so it uploads cleanly. Row 1 is a LONG entered at 22,678.50 on the 09:20 candle close of 14 October 2026 and exited at 22,608.60 on the 15:10 close: −69.90 points on the spot. Row 2 is a SHORT entered on a LOW and exited at an LTP; row 3 is a LONG held over a weekend, from 16 to 19 October.
Step by step
1. Pick the symbol and upload
Choose an index or type a stock's name in the Symbol box. The line under the upload shows that symbol's option data range. Choose your CSV; before sending anything the page checks the size, the required columns and the row count, and tells you exactly what is missing.
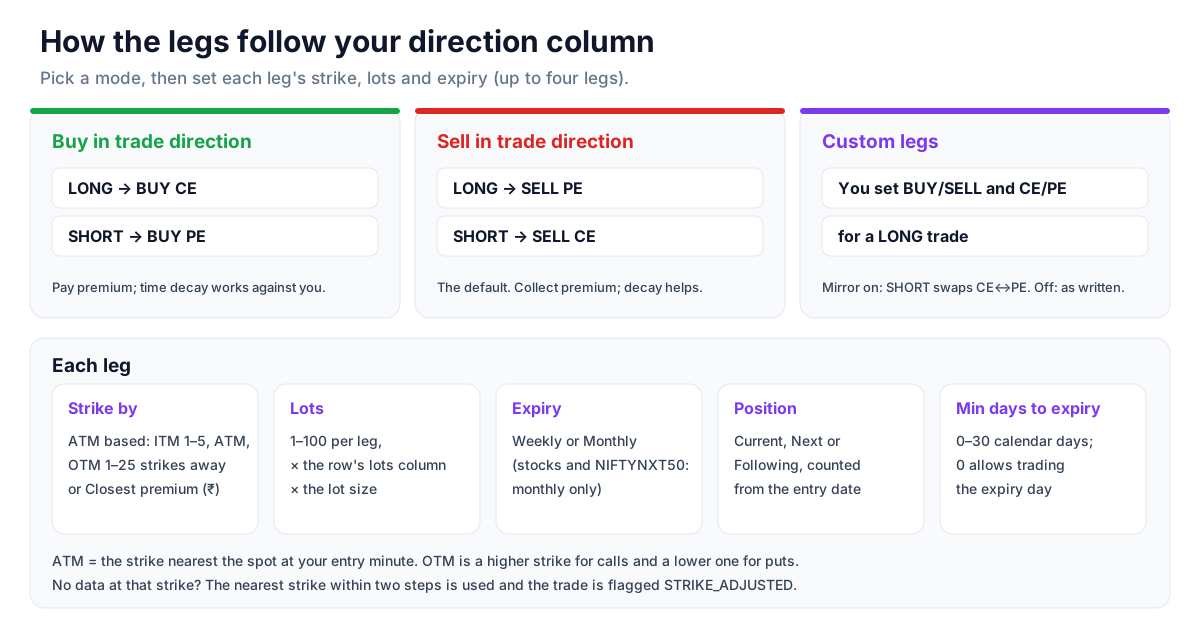
2. Choose how the legs follow the direction
- Buy in trade direction: LONG trades buy calls, SHORT trades buy puts.
- Sell in trade direction (default): LONG trades sell puts, SHORT trades sell calls.
- Custom legs: you set side (buy or sell) and type (CE or PE) for each leg, written for a LONG trade. With "Mirror legs for SHORT trades" on, a SHORT trade swaps every CE for a PE and back; turn it off to use the legs exactly as written for every trade.
3. Set up the legs (up to four)
- Strike by: "ATM based" (ITM 1 to 5, ATM, OTM 1 to 25 strikes away) or "Closest premium" (the strike whose option price at entry is nearest a target in rupees).
- Lots: 1 to 100 per leg, multiplied by the row's lots column.
- Expiry: Weekly or Monthly, and Position: Current, Next or Following.
- Min days to expiry: 0 to 30. Skips any expiry closer than that many calendar days; 0 allows trading the expiry day itself.
ATM is the strike nearest the spot at your entry minute: NIFTY rounds to its 50-point step, and every other symbol uses the strikes actually listed at that minute. OTM means a higher strike for calls and a lower one for puts. If the exact strike has no data, the nearest strike within two steps is used and the trade is flagged.
4. Run it
Press "Run options backtest". A progress bar follows the run; large files take a little while. You can have one run going at a time. The results stay available for about an hour after the run ends and are not saved in this version, so download the CSV to keep them.
Reading the results
The counts
- Rows in file, Rejected rows (failed a format or data check), Priced trades, and Skipped trades (valid, but no option data to price them).
Spot against options
Two cards side by side: your spot trades' total and average in points, and the options' total and average in rupees at the slippage picked (0%, 0.5% or 1%). Under them, the full backtest analysis for the option trades, the same cards and charts as Unfluke's backtesters.
How slippage is applied
Slippage is a percentage of each option price, against you on both sides: a buy fills higher and sells lower, a sell fills lower and buys back higher. An illustrative example (made-up premiums, not a real fill): a put sold at ₹120 and bought back at ₹150 loses 30 points at 0%. At 0.5% it is sold at ₹119.40 and bought back at ₹150.75, a 31.35-point loss, and the rupee loss is that times the quantity. On cheap options, 1% is a small number of rupees; on a 4-leg trade it adds up eight times.
The trades table
One line per priced trade with its net P&L. Click a trade to see both spot candles (O, H, L, C and volume) and every leg: the contract, expiry, strike, entry and exit premiums with the candle field used, quantity, points and P&L, and any warnings.
Warnings: priced, but read them
- PRICE_OUTSIDE_CANDLE, BASIS_MISMATCH: your price is a little off Unfluke's candle, or does not match the field your basis names. Small differences are normal between data vendors.
- STRIKE_ADJUSTED: the strike asked for had no data; the nearest within two strikes was used.
- STALE_CANDLE, STALE_EXIT: the option did not trade that minute; a carried-forward or earlier price was used.
- EXPIRED_BEFORE_EXIT: the contract expired before your exit, so it was closed at 15:29 on expiry day. Common when a trade held over days uses the current weekly expiry; raise "Min days to expiry" or pick the next expiry.
- OPENING_MINUTE: a HIGH, LOW or LTP fill in the noisy 09:15 candle.
- SAME_CANDLE: entry and exit in the same minute.
- LOT_SIZE_ESTIMATED: lot sizes are on file from January 2024; an older stock trade uses the earliest one, so its rupee P&L is approximate (points are exact). Index lot sizes before then follow NSE's published revisions.
Rejected rows and skipped trades
Two tables at the bottom list each problem row with its row number, trade id, a code and a message, and for rejected rows the column at fault. Rejections are things to fix in the file: a bad date or time, a time outside 09:15 to 15:29, an exit before the entry, an unknown direction or basis, a symbol that does not match, or PRICE_MISMATCH, a price more than 2% outside Unfluke's candle, which almost always means a time-zone, symbol or candle-end labelling problem. Skips are data gaps: DATA_NOT_AVAILABLE (outside the data range), NO_EXPIRY, NO_CONTRACT or NO_EXIT_DATA.
The CSV download
One row per priced trade, at the slippage picked: your trade's fields and spot points, then for each of up to four legs the ticker, side, expiry, strike, type, entry and exit premium, quantity, lot size and P&L, then the net P&L and the warning codes.
Ways to use it (ideas, not promises)
- Buy vs sell: run the same log twice, once "Buy in trade direction" and once "Sell in trade direction". Short-holding systems and long-holding ones often favour different sides, because time decay works for sellers and against buyers.
- Strike distance: compare ATM with OTM 2 or 3. Cheaper strikes cost less per trade but need a bigger move.
- Spreads: use Custom legs to buy ATM and sell OTM 2 of the same type, capping the risk of a naked leg.
- Expiry choice: for trades held over several days, test the next weekly or the monthly against the current weekly, and check the EXPIRED_BEFORE_EXIT count.
- Be honest about slippage: judge results at 0.5% or 1%, not 0%, especially for many short trades.
These are ideas to study, paper-trade and backtest, not recommendations or signals, and not a promise of any result. Past option prices are no guarantee of future fills, and backtests leave out impact cost and taxes. Size, entries, exits and risk are your own decisions.
Limits and plans
- Runs per plan cycle: Free 3, Advanced 5, Pro 10. The page shows the runs left and when they reset. Runs that fail or price no trades are given back.
- Visitors can open the page, read the format guide and download the template; running a conversion needs a free account.
- Per run: up to 5,000 rows, 2 MB and 4 legs; one run at a time per account.
- Results are kept about an hour after a run ends and are not saved in this version. Download the CSV.
Where to go next
To build a strategy from scratch rather than convert one, read how to backtest an options strategy and the options backtesting platform overview; to test a single position by hand, the Option Simulator guide. Open the converter at Trade log → Options, or sign up free to run it.
More from the blog
- Strategy Backtesting on Unfluke
Backtest trading strategies on real Indian market data with Unfluke. Test equity, Nifty, Bank Nifty and options strategies with realistic costs and key metrics.
- Live Market Scanners
Explore Unfluke's real-time stock scanner for NSE markets. Scan 1,800+ stocks with 40+ technical indicators, fundamental filters, F&O data and custom rules.
- Option Strategy Simulator
Build and simulate multi-leg options strategies with Unfluke. Visualize payoffs, Greeks, max profit and loss, and replay historical option data from 2023.