Market Terminal
Volume Gainers Explained: Reading Unusual Trading Activity
8 min read · Updated 2 Nov 2026
Volume and price are two different measurements of a session. The Volume Gainers tab on the Movers page ranks stocks by how far today's volume is running above their own average - information that is easy to miss if you only look at top gainers.
This article covers how volume is measured against its average, how analysts interpret it, and what volume alone cannot tell you.
The metric: volume versus average, not raw volume
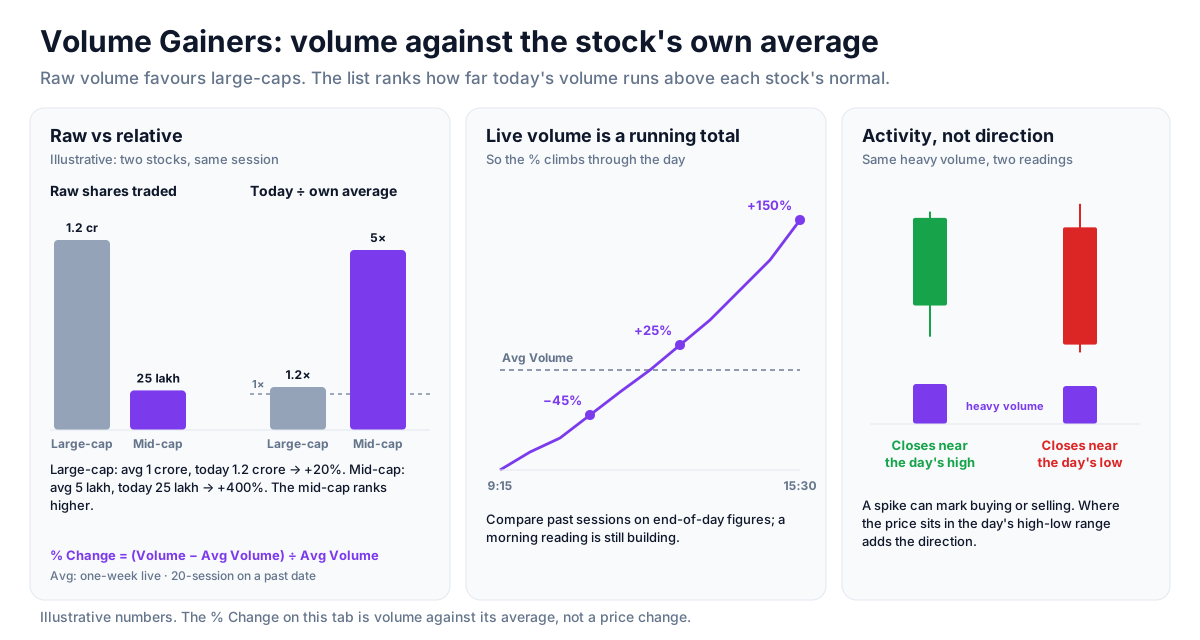
Raw volume favours large-caps that always trade heavily. What matters is volume relative to the stock's own average. The Volume Gainers tab shows Volume, Avg Volume (a one-week average live, a 20-session average on a past date) and a % Change column that is the volume change against that average - not a price change - plus Turnover in ₹ lakh. A mid-cap trading at several times its normal volume therefore ranks above a large-cap trading at its usual pace. During market hours volume is a running total, so the percentage climbs through the day.
Why it can matter even when price is flat
A stock can show a heavy volume spike while its price barely moves. Analysts often read this as possible quiet accumulation or distribution - a situation a top gainers list would not show. Whether that reading is right is only clear in hindsight, which is why it is a description, not a conclusion. For F&O stocks, the OI Buildup page adds context on whether fresh positions are being built.
Combining it with gaps and most active
The same stock often appears in more than one Movers tab, and reading the tabs together gives a fuller description. A stock on both Volume Gainers and Gap Up opened away from its previous close and is also trading heavily. A stock high on Most Active by volume but not by value suggests many small trades rather than a few large ones - see the most active value versus volume article.
What volume alone cannot tell you
A volume spike does not say which side is in control - it can mark buying or selling. That is why volume is best treated as a prompt to investigate, not a conclusion. The day's high-low range and where the price sits within it add useful direction to the reading.
Strategy ideas (ideas, not promises)
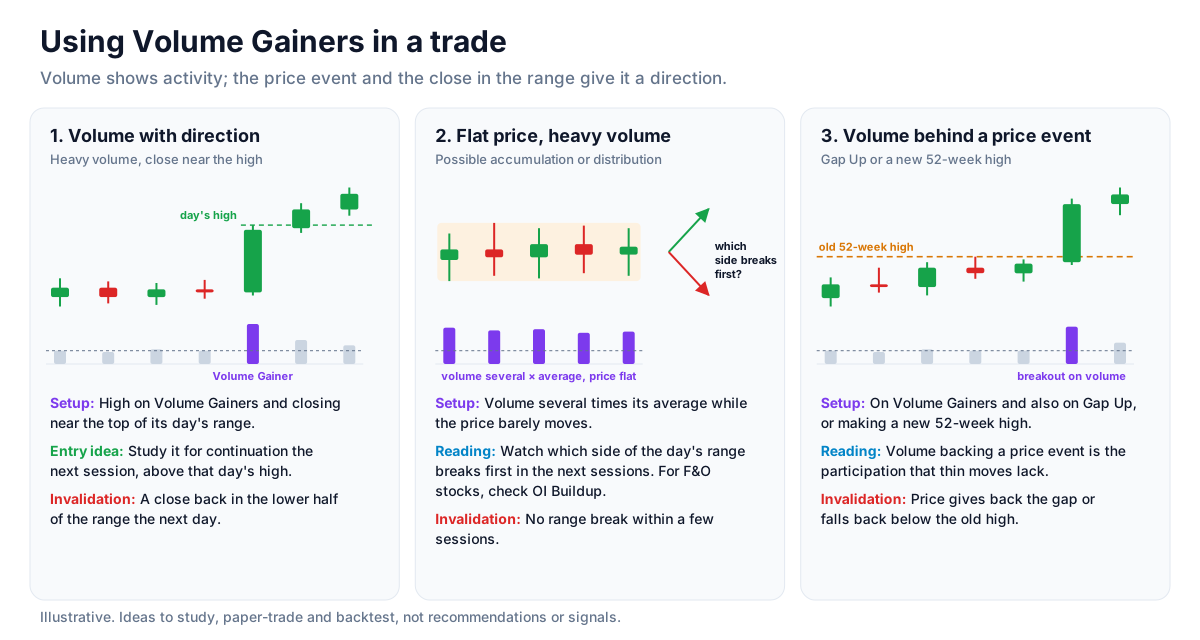
These are ideas to study, paper-trade and backtest, not recommendations or signals, and not a promise of any result. Heavy volume shows activity, not direction: it can mark buying or selling. Size, entries, exits and risk are your own decisions.
1. Volume with direction
- Setup: A stock high on Volume Gainers whose price is closing near the top of its day's range.
- Entry idea: Study it as a candidate for continuation the next session, above that day's high.
- Invalidation: A close back in the lower half of the range the next day.
2. Flat price, heavy volume
- Setup: Volume running several times its average while the price barely moves.
- Reading: Note it as possible accumulation or distribution and watch which side of the day's range breaks first in the following sessions. For F&O stocks, the OI Buildup page adds whether positions are being built.
- Invalidation: No range break within a few sessions: the volume told you nothing about direction.
3. Combine with a gap or a breakout
- Setup: A name on Volume Gainers that is also on Gap Up or making a new 52-week high.
- Reading: Volume backing a price event is the participation that thin moves lack.
- Invalidation: The price giving back the gap or falling back below the old high.
How to test these
Remember that live volume is a running total, so compare past sessions using the end-of-day figures from the date picker. Track what the top volume gainers did over the next three to five sessions, split by where they closed in their day's range.
Where to go next
Read most active by value versus by volume next, or return to the equity data guide. Get free access to the Volume Gainers tab.
How to Read This Data
The movers screen ranks stocks by the size of their price change, their volume and their opening gap. It shows where the market's attention was concentrated in a session. Studying it helps explain the difference between a move with broad participation and a short-lived spike in a thinly traded stock.
- Compare the percentage change with volume or turnover: a large move on low turnover usually reflects few participants.
- Notice whether a name appears across several tabs (gainers, volume gainers, most active) or in only one of them.
- Look at where the price sits within the day's range; a close near the high and a close near the low describe very different sessions.
- Review the same list on the following sessions to see how often large movers continued, paused or reversed.
Limitations: A ranking describes what already happened. It does not explain why a stock moved, and it cannot tell whether a move will continue or reverse.
More from the blog
- Strategy Backtesting on Unfluke
Backtest trading strategies on real Indian market data with Unfluke. Test equity, Nifty, Bank Nifty and options strategies with realistic costs and key metrics.
- Live Market Scanners
Explore Unfluke's real-time stock scanner for NSE markets. Scan 1,800+ stocks with 40+ technical indicators, fundamental filters, F&O data and custom rules.
- Option Strategy Simulator
Build and simulate multi-leg options strategies with Unfluke. Visualize payoffs, Greeks, max profit and loss, and replay historical option data from 2023.