Market Terminal
Corporate Actions Calendar: Dividends, Splits and Bonuses Explained
8 min read · Updated 2 Nov 2026
Dividends, stock splits, bonus issues and rights issues all move a stock's price mechanically on their ex-date, regardless of market sentiment - and missing that date can make a price chart look strange. The Corporate Actions tab on Market Info lists upcoming actions for the next 30 days with Symbol, Company, Ex-Date, Purpose, Record Date and Payment Date.
Why the ex-date matters most
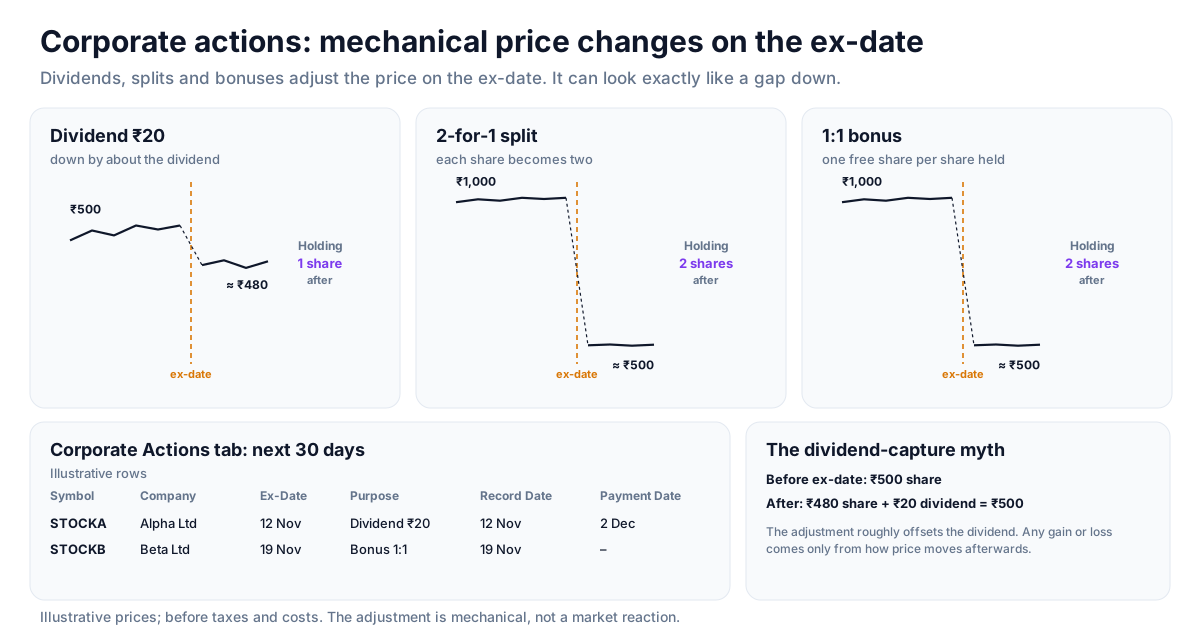
On the ex-date the share price is adjusted - down by roughly the dividend amount, or by the ratio of a split or bonus. It is a mechanical change, not a market reaction, yet it can look exactly like a gap down on a chart. Checking the calendar is the first step before interpreting an unexplained price drop in any stock.
A common misconception: dividend capture
A common misconception is that buying a stock just before its ex-date earns the dividend for free. In practice the ex-date price adjustment roughly offsets the dividend, so the dividend itself is not a gain - any difference comes only from how the price moves afterwards, which is unknown in advance. Analysts studying price behaviour after ex-dates often compare it with the stock's sector strength.
The New Listings tab
The same page's New Listings tab shows companies making their exchange debut, with the effective date and a flag for stocks that use the special pre-open session reserved for new listings. Debut sessions are naturally more volatile, so a stock's first few sessions of trading usually say more about its range than day one alone.
Strategy ideas (ideas, not promises)
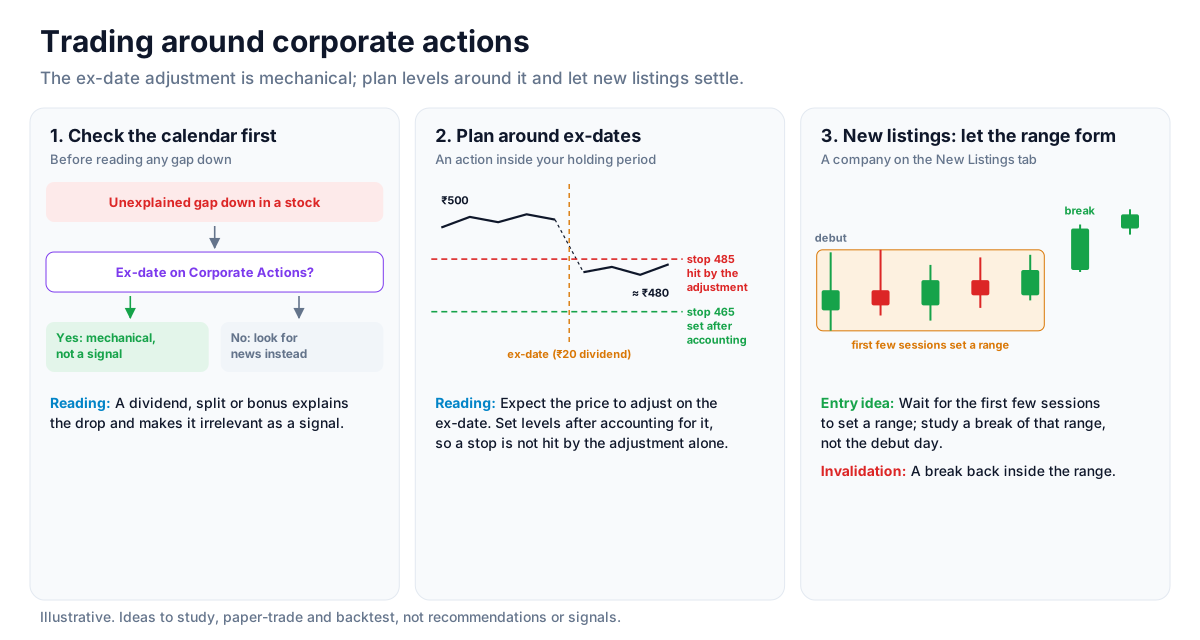
These are ideas to study, paper-trade and backtest, not recommendations or signals, and not a promise of any result. The ex-date adjustment is mechanical; price after it is unknown in advance. Size, entries, exits and risk are your own decisions.
1. Check the calendar before reading a gap
- Setup: An unexplained gap down in a stock you follow.
- Reading: Look for an ex-date on the Corporate Actions tab; a dividend, split or bonus explains the drop and makes it irrelevant as a signal.
2. Plan around ex-dates
- Setup: A stock with a dividend, split or bonus inside your holding period.
- Reading: Expect the price to adjust on the ex-date and set any levels after accounting for it, so a stop is not triggered by the adjustment alone.
3. New listings: let the range form
- Setup: A company on the New Listings tab.
- Entry idea: Wait for the first few sessions to set a range and study a break of that range rather than trading the debut day.
- Invalidation: A break back inside the range.
How to test these
Pick past ex-dates from the calendar and compare each stock's move over the following weeks with its sector index, to see whether the adjustment day told you anything at all.
Where to go next
Read how to read pre-open market data for the other half of Market Info, or return to the equity data guide. Try the Corporate Actions calendar free.
How to Read This Data
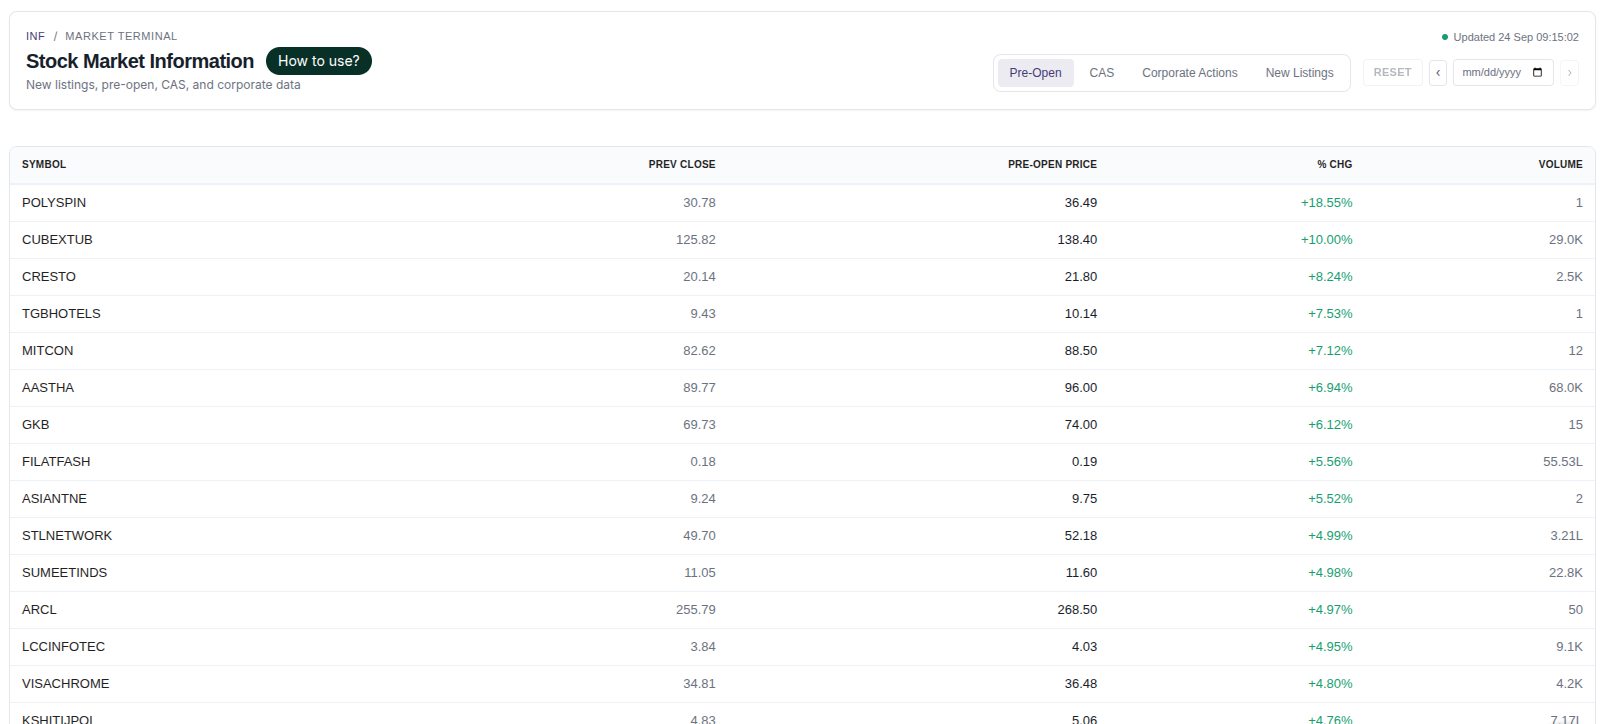
The market information screen collects session context: pre-open prices, the closing auction, corporate actions and new listings. These events explain many price moves that look unusual on a chart, such as a drop on an ex-dividend date.
- Use the pre-open data to see how the opening price was discovered before continuous trading began.
- Check corporate actions (dividends, splits, bonuses) before interpreting a sudden price change.
- Note new listings and other session events that can change normal liquidity.
- Compare the closing-session price with the last traded price to understand how the close was set.
Limitations: Event data explains context; it cannot tell how the market will react to an event. Some actions are announced well before they show up in prices.
More from the blog
- Strategy Backtesting on Unfluke
Backtest trading strategies on real Indian market data with Unfluke. Test equity, Nifty, Bank Nifty and options strategies with realistic costs and key metrics.
- Live Market Scanners
Explore Unfluke's real-time stock scanner for NSE markets. Scan 1,800+ stocks with 40+ technical indicators, fundamental filters, F&O data and custom rules.
- Option Strategy Simulator
Build and simulate multi-leg options strategies with Unfluke. Visualize payoffs, Greeks, max profit and loss, and replay historical option data from 2023.