Market Terminal
Pre-Open Market on NSE: How to Read It and What It Shows About the Open
10 min read · Updated 2 Nov 2026
The Market Info page shows NSE's pre-open session prices, the closing auction session (CAS), upcoming corporate actions and new listings in four tabs.
This guide focuses on the Pre-Open and CAS tabs: what the auction prices mean, how to read each column, and how the pre-open price relates to the opening of regular trading.
What is the pre-open market?
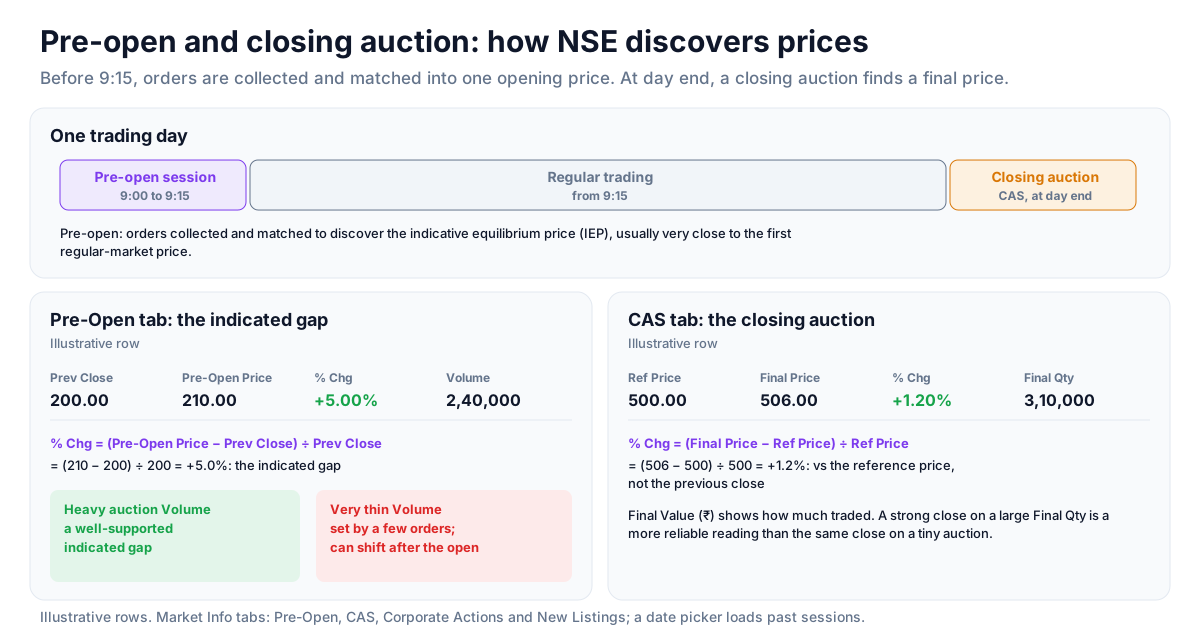
Before regular trading starts at 9:15, NSE runs a short pre-open session in which orders are collected and matched to discover an opening price for each stock - the indicative equilibrium price (IEP). It is usually very close to the stock's first price in regular trading. At the end of the day a similar auction, the closing auction session (CAS), discovers a final price.
The Market Info page has four tabs - Pre-Open, CAS, Corporate Actions and New Listings - and a date picker for past sessions.
How to read it
- Pre-Open: Prev Close - the previous session's close.
- Pre-Open: Pre-Open Price - the price discovered in the pre-open auction.
- Pre-Open: % Chg - the pre-open price against the previous close, i.e. the indicated gap.
- Pre-Open: Volume - shares matched in the auction.
- CAS: Ref Price and Final Price - the reference price for the closing auction and the price it discovered.
- CAS: % Chg - final price against the reference price, not the previous close.
- CAS: Final Qty and Final Value (₹) - how much traded in the auction.
Reading indicated gaps
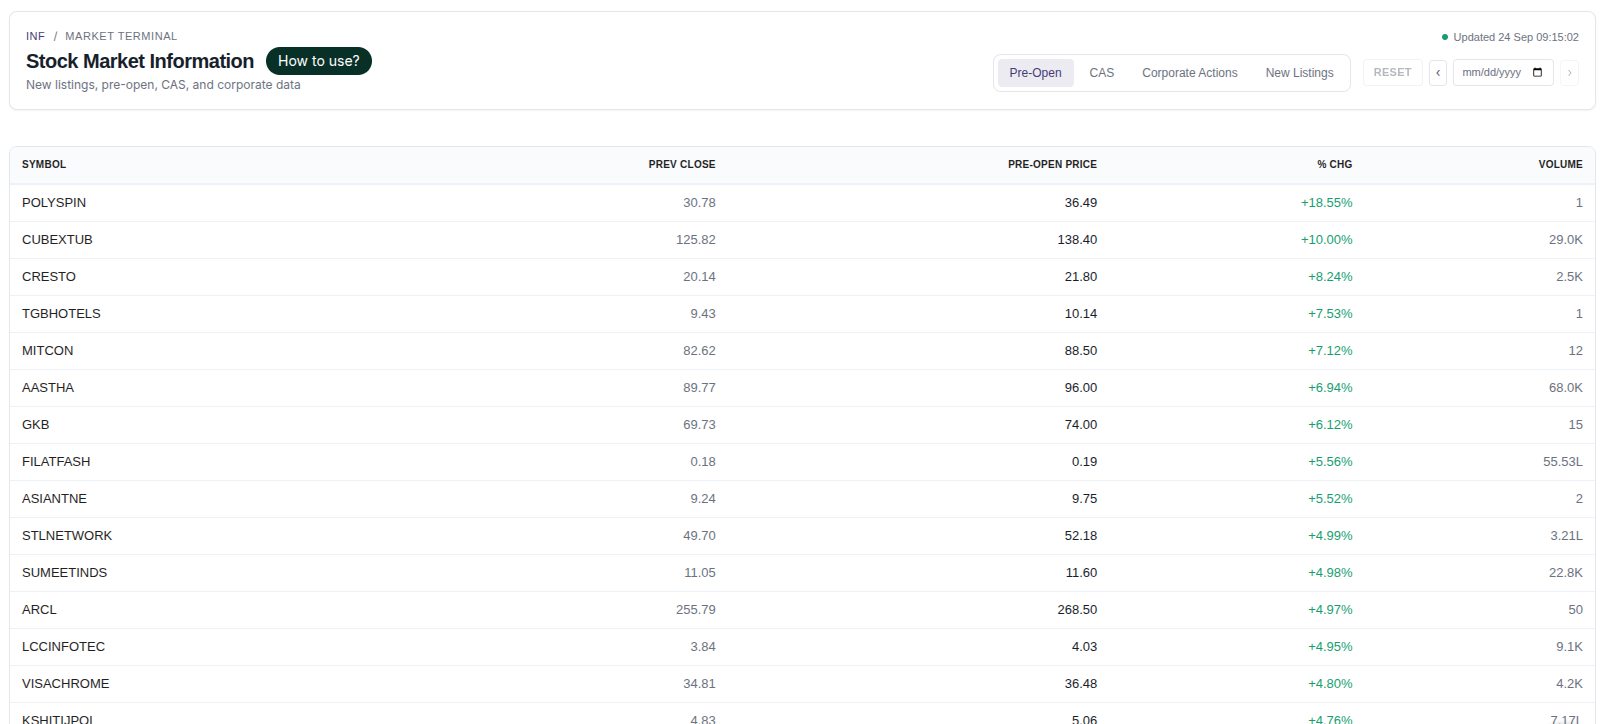
Sorting the Pre-Open tab by % Chg shows the largest indicated gaps in both directions. Each gap should be read together with its Volume: a large indicated gap on very thin auction volume was set by only a few orders and can shift once regular trading volume arrives. After the open, the actual gaps appear on the Gap Up and Gap Down tabs of the Movers page, so the two can be compared.
Concept: from indicated gap to actual open
The pre-open price is an indication, not a guarantee of the first regular-market price. Comparing the two over many sessions is a useful way to learn how much weight an indicated gap deserves - and why auction volume matters so much. What happens to a gap after the open, whether it holds or fades, is covered in reading gap up and gap down stocks.
Concept: reading the closing auction
The CAS tab shows whether a stock's closing print reflects genuine late-session demand or a thin auction. A strong close on a large Final Qty is a more reliable reading than a similar close on a tiny auction, which is why analysts check it before drawing conclusions from a closing price.
Strategy ideas (ideas, not promises)
These are ideas to study, paper-trade and backtest, not recommendations or signals, and not a promise of any result. The pre-open price is an indication; the first regular-market trade can differ. Size, entries, exits and risk are your own decisions.
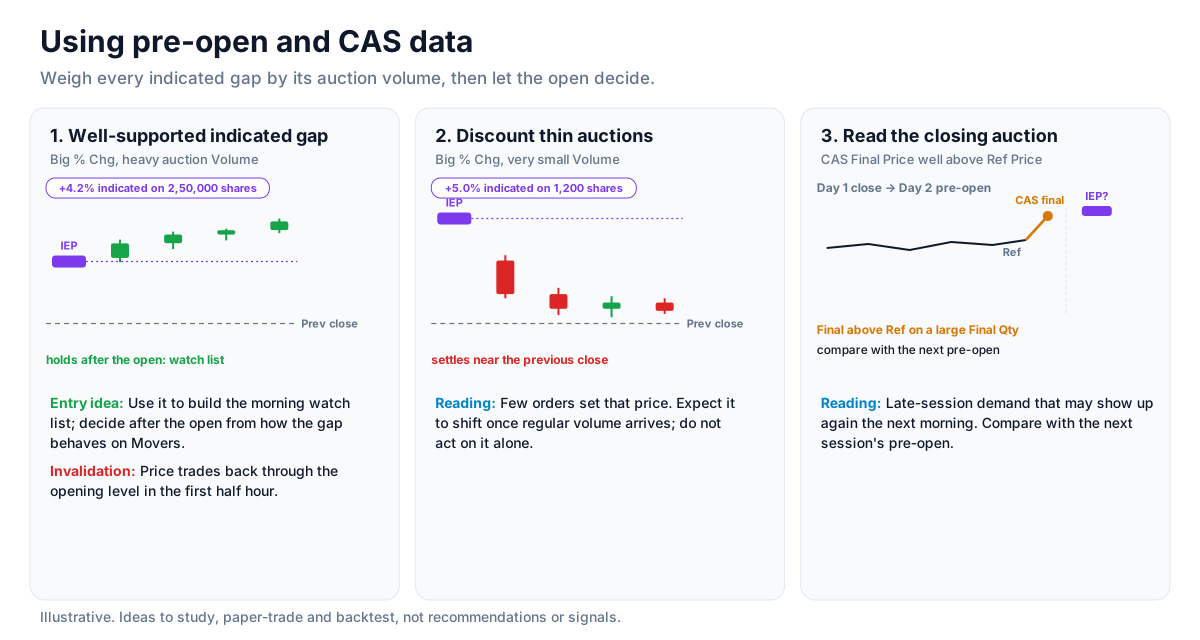
1. Well-supported indicated gap
- Setup: A large positive or negative % Chg on the Pre-Open tab with heavy auction Volume.
- Entry idea: Use it to build the morning watch list, then decide after the open using how the gap behaves on the Movers page.
- Invalidation: The price trading back through the opening level in the first half hour.
2. Discount thin auctions
- Setup: A large indicated gap on very small auction volume.
- Reading: Few orders set that price; expect it to shift once regular volume arrives and do not act on it alone.
3. Read the closing auction
- Setup: A CAS Final Price well above its Ref Price on a large Final Qty.
- Reading: Late-session demand that may show up again the next morning; compare with the next session's pre-open.
How to test these
Over many past sessions, compare each stock's pre-open price with its actual open and the day's close, split by auction volume, to learn how much weight an indicated gap deserves.
Where to go next
Continue to reading gap up and gap down stocks, or read the corporate actions calendar explained for the rest of Market Info. Explore the Market Info page free.
How to Read This Data
The market information screen collects session context: pre-open prices, the closing auction, corporate actions and new listings. These events explain many price moves that look unusual on a chart, such as a drop on an ex-dividend date.
- Use the pre-open data to see how the opening price was discovered before continuous trading began.
- Check corporate actions (dividends, splits, bonuses) before interpreting a sudden price change.
- Note new listings and other session events that can change normal liquidity.
- Compare the closing-session price with the last traded price to understand how the close was set.
Limitations: Event data explains context; it cannot tell how the market will react to an event. Some actions are announced well before they show up in prices.
More from the blog
- Strategy Backtesting on Unfluke
Backtest trading strategies on real Indian market data with Unfluke. Test equity, Nifty, Bank Nifty and options strategies with realistic costs and key metrics.
- Live Market Scanners
Explore Unfluke's real-time stock scanner for NSE markets. Scan 1,800+ stocks with 40+ technical indicators, fundamental filters, F&O data and custom rules.
- Option Strategy Simulator
Build and simulate multi-leg options strategies with Unfluke. Visualize payoffs, Greeks, max profit and loss, and replay historical option data from 2023.