Crypto
Crypto Gann Retracements: Eighths and Thirds of a Coin's Last Major Leg
10 min read · Updated 9 Nov 2026
Gann measured a pullback in eighths and thirds of the move before it, not in Fibonacci ratios, and he gave the 50% level the most weight. The crypto Gann Retracements page takes each USDT pair's last major leg, cuts it into those fractions, and lists the pairs sitting on one of them today.
The levels are percentages of the leg, so they mean the same thing for BTC at 75,000 as for a coin at 0.07. What is different on crypto is the clock: the leg is counted in calendar days, weekends included. This guide explains the rules, reads two real legs (BTCUSDT on 6 November 2026 and XRPUSDT through October), and turns them into strategy ideas.
The rules
All four pages measure from major swings. A swing point comes from Gann's two-bar swing chart (see the crypto Swing Chart guide); it is major when its high or low is also the highest or lowest of the ten days on either side of it. Crypto has no holidays, so that is ten calendar days: a swing becomes major ten days after it is made, and until then the pages keep measuring from the one before it.
- The leg runs between the last major swing low and the last major swing high, which must be 20 to 60 days apart. Whichever came second sets the direction: low then high is an up leg, which retraces down; high then low is a down leg, which retraces up.
- The levels are 1/8, 1/4, 1/3, 3/8, 1/2, 5/8, 2/3, 3/4 and 7/8 of the leg.
- A pair is listed only while price is inside the leg: between 0% and 100% given back. A close beyond the leg's start breaks it, and the pair leaves the page until a new leg forms.
- A pair is at a level when its close is within 0.5% of it, and at least three days after the leg ended.
Two things to know about the leg
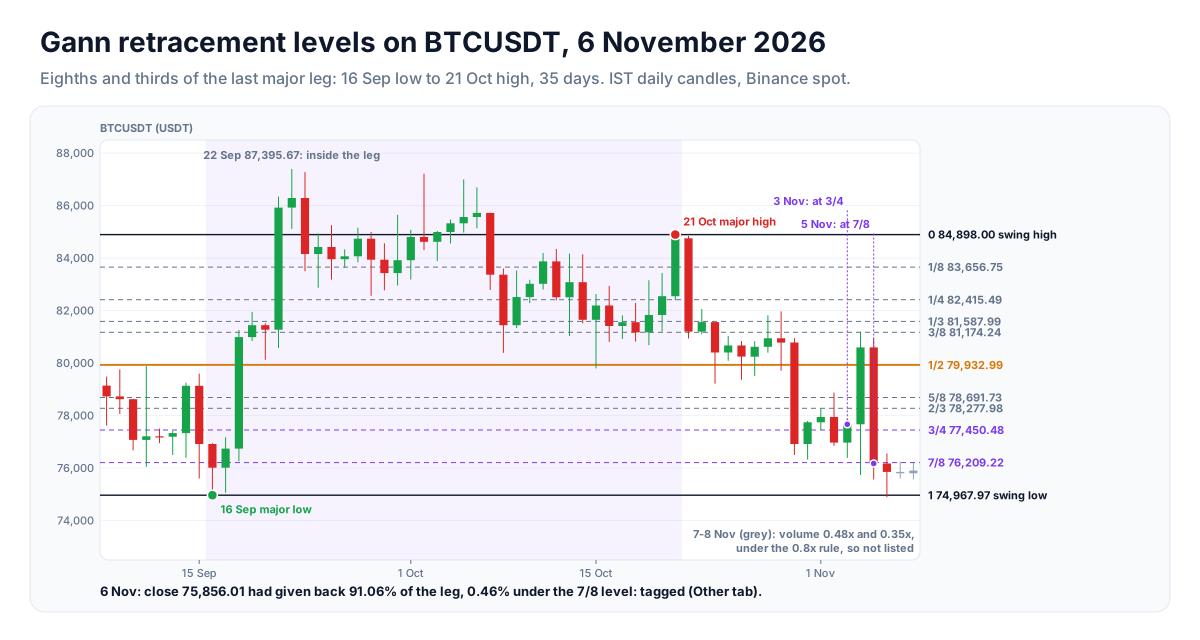
The leg is the last major low to the last major high, not the highest high in between. BTC made a higher high, 87,395.67, on 22 September, inside its leg; XRP spiked to 1.6999 on 22 August, inside a leg that ends at 1.6581. Neither changes the levels.
And because the leg is 20 to 60 calendar days, on crypto that is 20 to 60 candles. On NSE the same 20 to 60 sessions span four weeks to three months; here it is three weeks to two months.
A worked example: BTCUSDT, 3 to 6 November 2026
The page's newest days when this was written, 7 and 8 November 2026, were a weekend and listed one pair and none (see the volume rule below), and past dates need a signed-in session. So the rows in this guide come from running the page's own Gann code on Binance spot daily candles grouped into IST days, the source of Unfluke's crypto archive. The page's figures for these days should match, or differ by a day where the archive's feed missed one.
On Friday 6 November 2026, 16 of the 30 sample pairs passed the volume rule and six were inside a qualifying leg. Two were on a level: AAVEUSDT at 3/4 and BTCUSDT at 7/8.
- The leg: an up leg of 35 days, from the 16 September major low of 74,967.97 to the 21 October major high of 84,898.00, a range of 9,930.03.
- The main level: 1/2 at 79,932.99. 3/8 sits at 81,174.24 and 5/8 at 78,691.73.
- 3 November: BTC closed at 77,670.02, 72.79% given back, 0.28% above the 3/4 level at 77,450.48. Listed under Other.
- 4 November: a 3.77% rally took it to 80,600.01, back to 43.28% given back. Its high, 81,196.01, stopped 22 dollars above 3/8 (81,174.24).
- 5 November: it fell 5.49% to 76,176.01, 0.04% under 7/8 (76,209.22). Listed again.
- 6 November: 75,856.01, 91.06% given back, 0.46% under 7/8. Its low, 74,888, poked below the leg's start before the close came back inside.
The weekend that followed kept BTC on 7/8 (0.53% and 0.39% away) but on 0.48× and 0.35× its average volume, so the page did not list it. When this guide was written, on 9 November, BTC had traded as low as 73,510, below the leg's start. A close there ends the leg, and BTC leaves the page.
How to use it in a trade
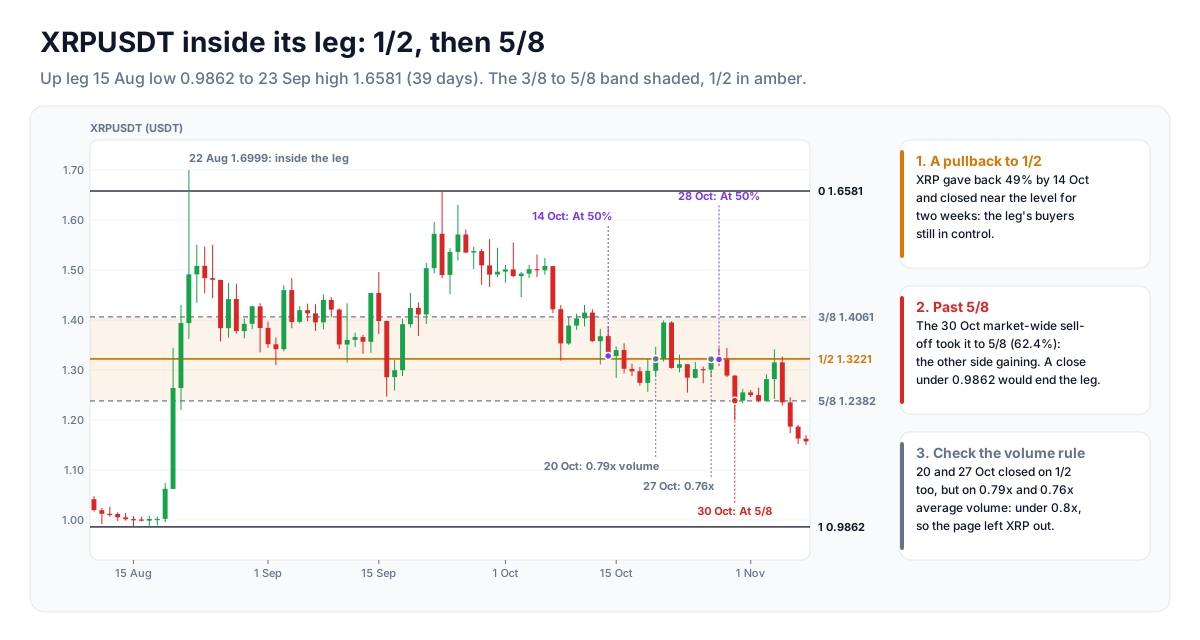
XRPUSDT in October 2026 shows the whole sequence:
- Find the level. On 14 October XRP closed at 1.33, 49.14% of its 39-day up leg given back, 0.43% above the 1/2 level (1.32): the At 50% tab.
- Watch whether it holds. For two weeks XRP closed between 1.27 and 1.40, mostly within 3% of the 1/2 level, and on 28 October it was At 50% again (50.13% given back). A pullback that rests on 1/2 says the leg's buyers have not left.
- Know the line that changes the reading. On 30 October, the day most large pairs fell together on heavy volume, XRP dropped 3.88% to 1.24, 62.42% given back: the At 5/8 tab. Past 5/8, Gann's reading is that the other side is gaining.
- Mind the gaps in the list. On 20 and 27 October XRP closed almost exactly on 1/2 (50.01% and 50.07%), but on 0.79× and 0.76× its average volume. Under the 0.8× rule, the page left it out both days. A pair you are following can vanish from the list without having moved.
Risk per trade - risk a small, fixed share of capital on any one idea. Crypto never closes, so a stop is the only exit while you sleep; with leverage, keep the liquidation price well beyond the stop. When selling options, prefer defined-risk structures (spreads, iron condors) over naked positions.
Strategy ideas (ideas, not promises)
These are ideas to study, paper-trade and backtest, not recommendations or signals, and not a promise of any result. Every condition below can fail. Crypto trades around the clock and can move sharply at any hour; leverage and options can lose more than you expect, and past behaviour says nothing certain about the next session. Size, entries, exits and risk are your own decisions.
1. The 50% hold
- Setup: a pair on the At 50% tab, like XRP on 14 October.
- Idea: a turn back in the leg's direction from the 1/2 level, on rising volume, keeps the original move in charge. Write the trigger before the day: for example, a daily close back above 3/8.
- Invalidation: a daily close beyond 5/8, as XRP made on 30 October.
2. A deep retracement tests the leg's start
- Setup: a pair at 7/8, like BTC on 5 and 6 November. Almost the whole leg is gone, and the leg's start (BTC's 74,967.97) is the level that matters.
- Idea: a bounce from near the start that reclaims 3/4 shows buyers defending the low; a close below the start ends the leg and, with it, the case.
3. Use the levels as targets, not just entries
BTC's 4 November rally stopped within 22 dollars of 3/8. For a position taken near 7/8 or 3/4, the next levels up (5/8, 1/2, 3/8) are natural places to take part of the profit.
How often it happens
In the 30-pair sample from 1 April to 6 November 2026, a pair was on a level on 187 of 3,742 liquid pair-days: at 50% on 20, at 3/8 on 24, at 5/8 on 17, at 1/3 on 24, at 2/3 on 12, and on one of the others on 90. Test any idea on the levels you would actually use.
Test before you trade - write the rules down exactly, test them on past data (see how to backtest an options strategy and the Option Simulator, which supports crypto), then paper-trade at least 20 occurrences before committing real money. Keep a journal of every trade, including the ones you skipped.
Every tab and column
- Tabs - All (every pair inside a qualifying leg, nearest level shown), At 50%, At 3/8, At 5/8, At 1/3, At 2/3, and Other for 1/8, 1/4, 3/4 and 7/8.
- Leg - Up leg (low then high, retracing down) or Down leg (high then low, retracing up).
- Swing High / Swing Low - the two ends of the leg.
- Retracement % - how much of the leg has been given back.
- Nearest - the closest Gann level and its price.
- Distance % - (close − level) ÷ level. Within ±0.5%, and at least three days after the leg ended, is "at" the level.
- Tag and Chart - the level the pair is at, and a pop-up with the leg shaded and all nine levels drawn.
Click a row to open its Gann squares (the Square of 9, the Gann Wheel, the Square of 144 and the Hexagon) for that pair's price.
What the numbers are built from
- Pairs. The live USDT pairs in Unfluke's crypto archive (34 on 8 November 2026). A pair whose 20-day average range is under 0.25% of price is not scanned, which keeps stablecoins out.
- Liquidity first. A pair is listed only if its 20-day average turnover is above US$500,000, today's turnover above US$100,000, and today's volume above 0.8× the average of the previous 20 days. There is no circuit rule; crypto has no price bands.
- Days. Daily candles are IST calendar days, 00:00 to 23:59, rolled up from the one-minute Binance spot archive. Everything is end of day, and the newest day is topped up during the day, so it can be partial until 23:59 IST.
- Quiet days empty the page. The volume rule compares a day with the 20 before it, and weekends trade less. On Saturday 7 and Sunday 8 November 2026 most large pairs traded about a third of their average, so the Gann pages listed one pair and then none. A row can also drop out on a weekday: XRPUSDT closed exactly on its 50% level on Tuesday 20 October, on 0.79× its average volume, and was not listed.
- Day counts. "Days Since" on the Fan and Squaring pages counts daily candles; Time Cycles counts calendar days. On crypto these are the same number, except where the archive is missing a day (August and September 2026 have one each), when the candle count is one lower.
- Universe. All, Futures (pairs with a perpetual future in the archive) or Options (BTC and ETH).
- Prices. Shown to two decimals at 1 USDT and above, and to four significant figures below it, so 0.003499 is not flattened to 0.00.
Gann levels, angles and cycles are research references. They describe geometry on a price chart, not a forecast, and prices move through them regularly.
Where to go next
Open the page at Gann → Gann Retracements (switch the market to Crypto). The NSE version is explained in the Gann Retracement Levels guide.
The other crypto Gann guides: Swing Chart, Square of 9 Levels, Level Cross, Cardinal & Diagonal, Degree Levels, Gann Fan, Time Cycles, Price-Time Squaring. For a day's unusual volume, read the crypto Volume Shockers guide; for positioning in the perpetuals, the OI Buildup guide. Sign up free to open the Market Terminal.
More from the blog
- Strategy Backtesting on Unfluke
Backtest trading strategies on real Indian market data with Unfluke. Test equity, Nifty, Bank Nifty and options strategies with realistic costs and key metrics.
- Live Market Scanners
Explore Unfluke's real-time stock scanner for NSE markets. Scan 1,800+ stocks with 40+ technical indicators, fundamental filters, F&O data and custom rules.
- Option Strategy Simulator
Build and simulate multi-leg options strategies with Unfluke. Visualize payoffs, Greeks, max profit and loss, and replay historical option data from 2023.