Crypto
Crypto Relative Strength Rating: Which USDT Pairs Are Beating Bitcoin
10 min read · Updated 9 Nov 2026
In crypto, almost every coin rises and falls with Bitcoin. That makes a coin's own price chart a poor guide to whether it is strong: a pair up 20% in a month when BTC is up 30% has lost ground. The question traders actually ask is which coins are doing better than the market they all follow.
The Relative Strength Rating page answers it two ways. It ranks every live USDT pair from 1 to 99 on a weighted mix of its recent returns, and it draws each pair's RS line against BTCUSDT. This guide explains both, reads the real rows of 6 November 2026, and points out the two places where the crypto version needs care: BTC's own row, and a rating spread across only 34 pairs. The NSE version is explained in the Relative Strength Rating guide.
What the rating and the RS line measure
The score
Each pair gets a score from its daily closes, the same formula as IBD's relative strength:
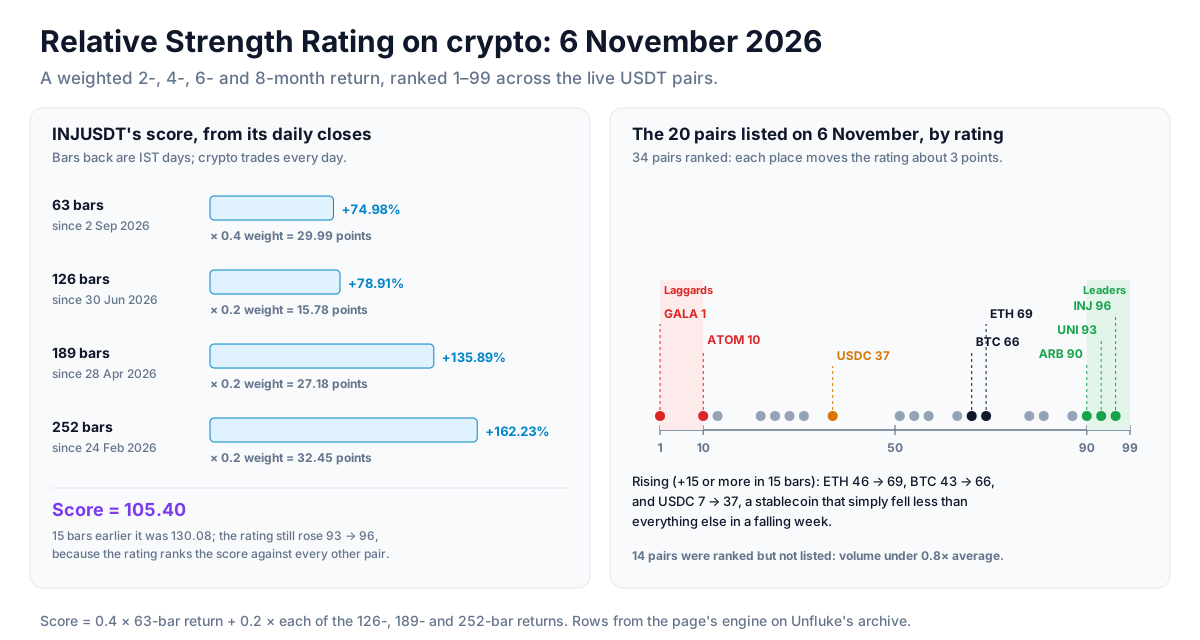
Score = 0.4 × the 63-bar return + 0.2 × the 126-bar return + 0.2 × the 189-bar return + 0.2 × the 252-bar return
The most recent stretch carries twice the weight of each older one, so a coin that has turned up lately scores better than one whose gains are all from months ago. A pair needs 252 bars of history to get a score.
On crypto those bar counts are shorter in calendar time than on NSE, because there is a bar every day: 63 bars is about two months, 126 about four, 189 about six and 252 about eight and a half. The page's columns keep the NSE labels 3M, 6M and 12M; on crypto, read them as 2, 4 and 8 months.
The rating
The score is then ranked against every other scanned pair and mapped to 1 to 99: 99 is the strongest, 1 the weakest. The rating ranks every pair with a year of bars, liquid or not; only the liquid ones are listed. The same score 15 bars earlier is ranked the same way, and the difference is the Δ 15D column.
Here is the first crypto difference. On NSE the rating ranks about 2,000 stocks, so a rating of 90 means "stronger than 90% of the market" with fine steps. On crypto it ranks 34 pairs, so each place is worth about 3 points. Leaders (90+) are the top three or four pairs, Laggards (10 or less) the bottom three or four, and a jump of 15 points can be a move of five places.
The RS line
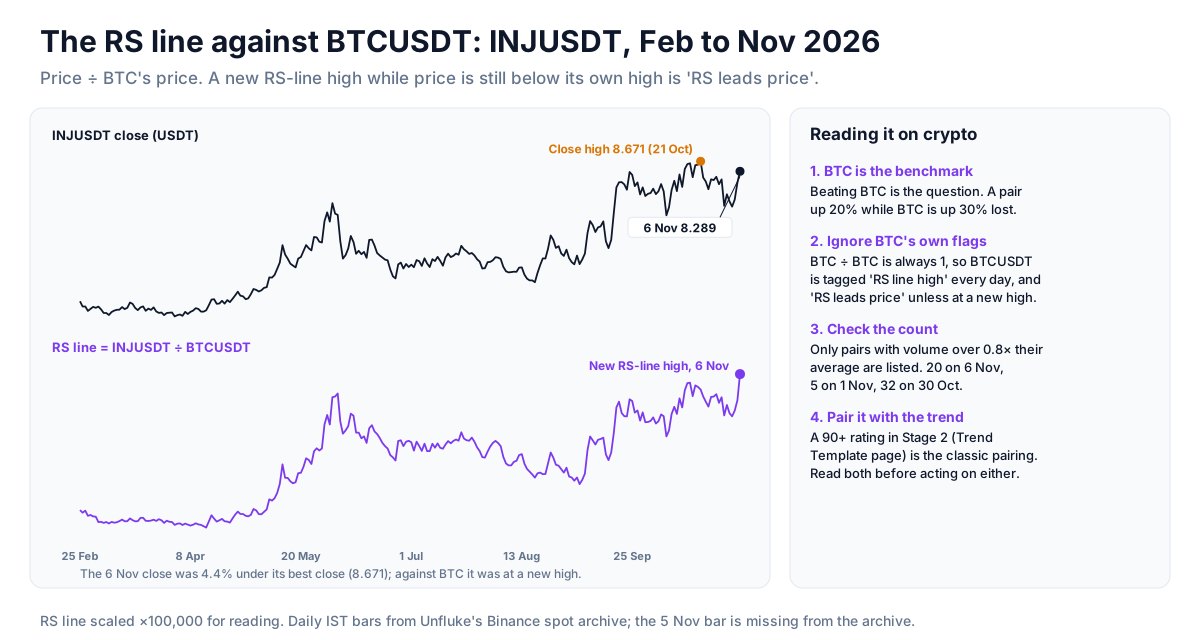
The RS line is the pair's close divided by BTCUSDT's close on the same day. When it rises, the coin is beating Bitcoin; when it falls, Bitcoin is beating the coin, even if both are going up. The page flags an RS line high when today's value is at or above every value of the last 250 bars, and RS leads price when the RS line makes that high while the price itself is still below its best close of the same window. Traders watch the second one because strength against the market often shows before the price breaks out.
Which pairs are listed, and why the list changes size
- The live USDT pairs in Unfluke's crypto archive: 34 in November 2026. A pair is live if its feed has a bar within the last three days.
- Liquid today: a 20-day average turnover above US$500,000, and the day's volume above 0.8× its own 20-day average. Pairs whose average daily range is under 0.25% (the stablecoins, almost always) are left out.
The second rule matters more on crypto than on NSE. Crypto volume drops sharply at weekends, so on a quiet day most pairs trade under 0.8× their average and drop off every list. From 1 September to 7 November 2026 the pages listed a median of 17 pairs a day: about 19 on weekdays, about 10 on Saturdays and Sundays, as few as 1 (Saturday 7 November) and as many as 32 (Friday 30 October, a sell-off). A short list on a Sunday is the volume rule at work, not a broken page. For a fuller picture, read a weekday.
Reading the real rows: 6 November 2026
On 6 November 2026 the page ranked all 34 live pairs and listed the 20 that passed the volume rule. It was a weak stretch: the archive has no bar for 5 November, so each pair's change is over two days, and BTCUSDT was down 5.89% to 75,856.01.
INJUSDT: the leader, and RS leads price
- RS Rating 96, up from 93 fifteen bars earlier.
- 3M +74.98%, 6M +78.91%, 12M +162.23% (63, 126 and 252 bars). The 189-bar return, used in the score but not shown, was +135.89%.
- Score 105.40: 0.4 × 74.98 + 0.2 × 78.91 + 0.2 × 135.89 + 0.2 × 162.23.
- RS Line 20D +3.86%, and the RS line at a new 250-bar high.
- Signals: Leader, RS line high, RS leads price. The close of 8.289 was up 5.54% while BTC fell, and still 4.4% under INJ's best close of the window (8.671 on 21 October).
The detail worth noticing: INJ's score was lower than 15 bars earlier (105.40 against 130.08), yet its rating rose from 93 to 96. The rating is a rank. Everything else lost more ground, so INJ moved up the order while its own score fell.
The other leaders, and two that rose
- UNIUSDT 93 and ARBUSDT 90 made up the rest of the Leaders tab. UNI fell 9.58% over the two days; one bad stretch does not undo eight months of returns.
- ETHUSDT 69, up 23 from 46, and BTCUSDT 66, up 23 from 43: both on the Rising tab, in a week when both fell. Rising measures rank, not price: over those 15 bars the scores of the pairs around them fell further.
Two rows to read with care
- BTCUSDT's RS flags. BTC's RS line is BTC divided by itself, which is always 1. A flat line is at its high every day, so BTCUSDT is always tagged "RS line high", and "RS leads price" whenever it is not at a new closing high. On BTC's row, those two flags carry no information. Its rating does.
- USDCUSDT 37, up 30 from 7, on the Rising tab. USDC is a stablecoin pinned near $1. It normally fails the range rule, but a few days with wide wicks lifted its 20-day average range just past 0.25% and it was listed. Its rating rose because every other coin fell while it stood still. A stablecoin's rating says nothing about strength; skip it.
The laggards
GALAUSDT 1 (12M −53.84%) and ATOMUSDT 10 (12M −29.95%) filled the Laggards tab. Both had RS lines that had fallen more than 12% against BTC in 20 bars.
How to use it in a trade
A step-by-step way to go from the list to a plan:
- Start with BTC. The whole page is relative to it. In a falling market a high rating can mean "fell less"; decide first whether you want longs at all.
- Shortlist from Leaders and RS Leads Price. A rating of 80 or more with an RS line rising over 20 bars is a coin outperforming Bitcoin on both the long view and the short one.
- Check the trend. Open the Trend Template & Stages page. A leader in Stage 2 (above a rising 150-day average) is the textbook combination; a high rating in Stage 3 or 4 means the strength is from months ago.
- Look for a setup on the chart. Strength tells you where to look, not when to act. A tight range or a base under a level (the VCP & Darvas Box page) gives a price to act on and a price that says you were wrong.
- Check positioning. The Perp Basis Scanner shows whether the perpetual is at a large premium, which often means the strength is already crowded with leveraged longs.
- Re-rank weekly, not daily. With 34 pairs, one day's move can shift a rating several points. The 15-bar change is the steadier read.
Risk per trade - risk a small, fixed share of capital on any one idea. Crypto never closes, so a stop is the only exit while you sleep; with leverage, keep the liquidation price well beyond the stop. When selling options, prefer defined-risk structures (spreads, iron condors) over naked positions.
Strategy ideas (ideas, not promises)
These are ideas to study, paper-trade and backtest, not recommendations or signals, and not a promise of any result. Every condition below can fail. Crypto trades around the clock and can move sharply at any hour; leverage and options can lose more than you expect, and past behaviour says nothing certain about the next session. Size, entries, exits and risk are your own decisions.
1. Leaders on a market pullback
- Setup: a pair rated 90 or more, in Stage 2, after BTC has pulled back for several days.
- Idea: study whether the leader holds above its own 50-day average while BTC falls. Leaders that hold during a pullback are the ones traders watch when BTC turns back up.
- Invalidation: a daily close under the 50-day average, or the RS line falling for 20 bars.
2. RS leads price
- Setup: the RS Leads Price tab, excluding BTCUSDT itself and any stablecoin.
- Idea: mark the pair's best close of the window (INJ's 8.671 on 6 November). A later close above it, with the RS line still rising, is the confirmation to study.
- Check: if the coin is only "beating BTC" by falling less, the RS line rises while both prices fall. Look at the price chart, not just the line.
3. Relative value against BTC
- Setup: a leader and a laggard that both have perpetual futures (the Futures universe).
- Idea: a long leader / short BTC position isolates the coin's strength from the market's direction. Size each leg by its volatility; altcoins usually move several times more than BTC.
Test before you trade - write the rules down exactly, test them on past data (see how to backtest an options strategy and the Option Simulator, which supports crypto), then paper-trade at least 20 occurrences before committing real money. Keep a journal of every trade, including the ones you skipped.
Every tab, filter and column
The tabs
- All - every listed pair, highest rating first.
- Leaders (90+) - rating 90 or more.
- Rising - rating up 15 points or more in the last 15 bars.
- RS Line High - the RS line at a new 250-bar high (BTCUSDT always qualifies).
- RS Leads Price - RS line at a new high while the close is not.
- Laggards (≤10) - rating 10 or less, weakest first.
The filters
- Date - the newest IST day by default; signed-in users can pick an earlier one.
- Universe - All, Futures or Options: pairs with a perpetual future, or options, in Unfluke's archive. The rating still ranks all 34 pairs.
The columns
- Symbol, LTP - the pair, its close and the day's change.
- RS Rating - 1 to 99.
- Δ 15D - the rating's change over 15 bars.
- 3M, 6M, 12M - returns over 63, 126 and 252 bars (about 2, 4 and 8 months on crypto).
- RS Line 20D - the change in the RS line over 20 bars; above zero, the pair beat BTC.
- Signal - Leader, Rising, RS line high, RS leads price, Laggard.
- 5 Days, Chart - the last five daily candles, and the daily chart.
What the numbers are built from, and what they cannot tell you
- Benchmark: BTCUSDT, in place of the Nifty 50. Strength here means strength against Bitcoin, not against the dollar.
- A small field. 34 pairs make a coarse ranking. Treat a 5-point difference as noise and look at the order, not the number.
- One exchange, spot only. The daily bars are rolled up from Unfluke's one-minute Binance spot archive into IST days, 00:00 to 23:59. Perpetual futures volume is not counted.
- Bars, not trading days. Every lookback counts daily bars, and crypto has a bar every day of the week. A "52-week" high is the highest of the last 252 bars, which is about eight months on crypto, not a year; a 200-day average spans about six and a half months.
- Missing days. The archive has no bar for 5 August, 11 September or 5 November 2026. On those dates the pages have nothing to show, and the next day's change is measured from the day before the gap, so it covers two days.
- The newest day can be unfinished. The daily bars are topped up during the day. Until 23:59 IST the day's volume is partial, so fewer pairs pass the 0.8× volume rule in the morning than at night. Signed-in users can pick a finished date.
- End of day only. Nothing here updates within the day from live prices; the scans are recomputed from the daily bars.
- Strength is backward-looking. Every input is a past return. A rating says what has worked, not what will.
Where to go next
Pair the rating with the trend on the Trend Template & Stages guide, find bases and breakouts with the VCP & Darvas Box guide, and see which coins move together in the Correlation & Pairs guide. For the day's breadth, read the Advance Decline guide. The NSE version is explained in the Relative Strength Rating guide. Open the page at Watch List → Relative Strength Rating (switch the market to Crypto), or sign up free to open the Market Terminal.
More from the blog
- Strategy Backtesting on Unfluke
Backtest trading strategies on real Indian market data with Unfluke. Test equity, Nifty, Bank Nifty and options strategies with realistic costs and key metrics.
- Live Market Scanners
Explore Unfluke's real-time stock scanner for NSE markets. Scan 1,800+ stocks with 40+ technical indicators, fundamental filters, F&O data and custom rules.
- Option Strategy Simulator
Build and simulate multi-leg options strategies with Unfluke. Visualize payoffs, Greeks, max profit and loss, and replay historical option data from 2023.