Crypto
Crypto VCP & Darvas Box Scanner: Bases, Boxes and Breakouts on USDT Pairs
11 min read · Updated 9 Nov 2026
Before many big moves, price goes quiet. It trades in a range, each dip is smaller than the last, and volume dries up as sellers run out. Two old methods turn that into rules: Mark Minervini's volatility contraction pattern (VCP), and the box method Nicolas Darvas described in the 1950s.
The VCP & Darvas Box page runs both on the live USDT pairs. This guide explains the rules, follows SOLUSDT through a VCP and a box to a breakout in September 2026 and BTCUSDT through a VCP that broke down in October, and points out one thing about how the page reports breakouts that every user should know. The NSE version is in the VCP & Darvas Box guide.
What a VCP and a Darvas box are
The VCP: shrinking pullbacks in an uptrend
The page looks for a VCP only in pairs that are already in an uptrend, and checks these rules on the daily bars:
- Stage 2 only, with the close above the 50-day average (see the Trend Template & Stages guide).
- The base starts at the highest high of the last 65 bars, and that high must be at least 10 bars old.
- Pullbacks inside the base are found with a zigzag: a swing counts once price reverses by 1.5 times the pair's ATR% (its average daily range as a percentage), held between 2% and 8%.
- There must be at least two pullbacks, each shallower than the one before. The first can be up to 35% deep, the last no more than 12%.
- Volume dries up: the 10-day average volume is below the 50-day average.
- The pivot is the high the last pullback started from.
VCP Forming: the close is within 10% under the pivot. VCP Breakout: the close is above the pivot today but was not yesterday, on at least 1.5 times the 50-day average volume.
The Darvas box: a high that holds, a low that holds
- The box top is a fresh 50-bar high that no high goes above for the next three bars.
- The box bottom is the lowest low after the top that no low goes under for the next three bars, while the highs stay under the top.
- A close above the top is a Box Breakout; a close below the bottom is a Box Breakdown. After either, the search starts again. Boxes are looked for over the last 120 bars.
The two often describe the same chart. A VCP is about the shape inside the range (each dip smaller, volume falling); a box is about its edges.
What changes on crypto
- Bars, every day. 65 bars is about nine weeks; 50 bars about seven.
- Wide swings. Many altcoins have an ATR% of 5% to 10%, so the zigzag often uses its 8% cap and only bigger swings count as pullbacks. The 12% limit on the last pullback rules out many alt bases that would pass on a calmer stock.
- Few pairs. With 34 live pairs and the volume rule, the lists are short: from 1 September to 7 November 2026 there were 11 VCP Forming rows on 10 different days, 33 Box Breakouts and 18 Box Breakdowns.
Which pairs are listed, and why the list changes size
- The live USDT pairs in Unfluke's crypto archive: 34 in November 2026. A pair is live if its feed has a bar within the last three days.
- Liquid today: a 20-day average turnover above US$500,000, and the day's volume above 0.8× its own 20-day average. Pairs whose average daily range is under 0.25% (the stablecoins, almost always) are left out.
The second rule matters more on crypto than on NSE. Crypto volume drops sharply at weekends, so on a quiet day most pairs trade under 0.8× their average and drop off every list. From 1 September to 7 November 2026 the pages listed a median of 17 pairs a day: about 19 on weekdays, about 10 on Saturdays and Sundays, as few as 1 (Saturday 7 November) and as many as 32 (Friday 30 October, a sell-off). A short list on a Sunday is the volume rule at work, not a broken page. For a fuller picture, read a weekday.
Two real charts: a breakout, and a breakdown
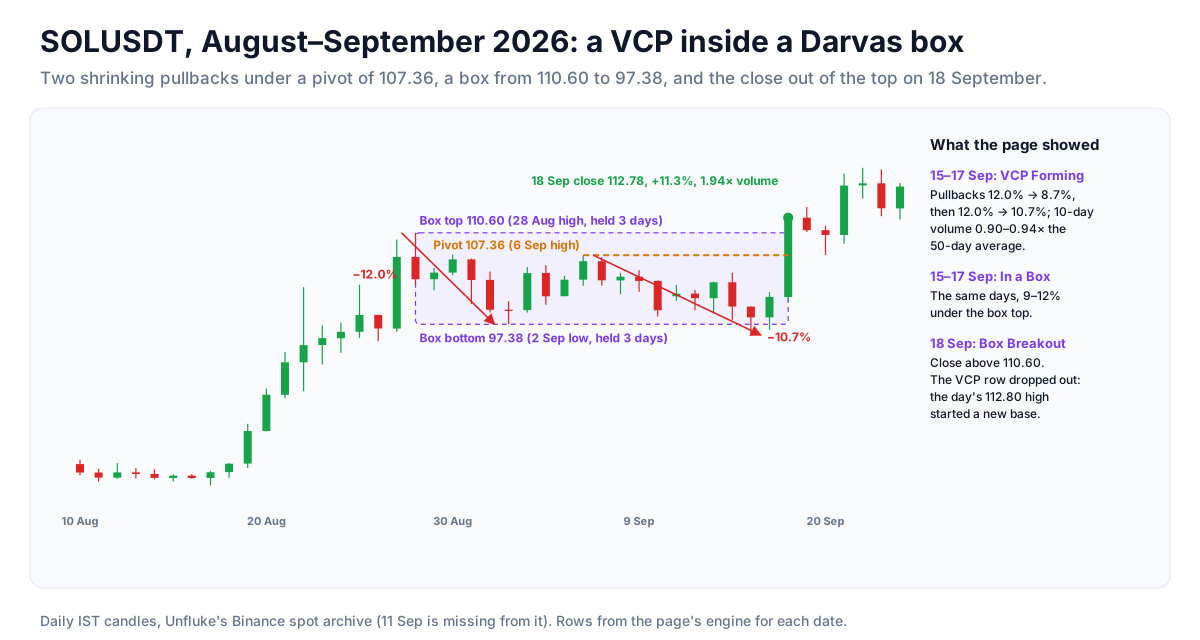
SOLUSDT, September 2026: from VCP to Box Breakout
- The box: top 110.60 (the 28 August high), bottom 97.38 (the 2 September low).
- The VCP: a first pullback of 12.0% from 110.60 to 97.38, then a second from the 6 September high of 107.36, the pivot.
- 15 September: VCP Forming, pullbacks 12.0% → 8.7%, close 99.95, 6.9% under the pivot; 10-day volume 0.92 times the 50-day. In a Box, 10.7% under the top.
- 16 September: the second pullback deepened to 10.7% (low 95.82), still shallower than the first, so still Forming.
- 18 September: close 112.78, up 11.3% on 1.94 times its 20-day volume, above the box top: Box Breakout. ETHUSDT, LTCUSDT and THETAUSDT broke out of their boxes the same day.
The close was also far above the VCP pivot of 107.36, on 1.95 times the 50-day average volume (the rule asks for 1.5), yet SOL did not appear on the VCP Breakout tab. The reason is in the base rule: the base starts at the highest high of the last 65 bars, and that high must be at least 10 bars old. SOL's high of 112.80 on 18 September was a new 65-bar high, so the base restarted that day and the VCP was gone. The breakout showed only on the Darvas side.
That is how the page works on any market, and it matters in practice: a VCP Breakout row appears only when the close clears the pivot but the day's high stays under the base's high. A strong breakout through both levels in one day drops off the VCP list instead. Across the 68 days from 1 September to 7 November no crypto pair appeared on the VCP Breakout tab. If you are tracking a VCP, set your own alert at the pivot rather than waiting for the tab.
BTCUSDT, October 2026: a VCP that broke down
- 5 October: VCP Forming, pivot 87,220 (the 2 October high), pullbacks 5.5% → 3.8%, close 85,566.01, 1.9% under the pivot; 10-day volume 0.89 times the 50-day. Also In a Box, top 87,395.67 and bottom 82,874.93.
- 7 October: still Forming, but the second pullback had deepened to 5.1% and the close of 83,368.01 was 4.42% under the pivot.
- 8 October: close 81,442.88, under the box bottom: Box Breakdown. INJ, LDO, LTC, NEAR and SOL broke down out of their boxes on the same day.
ETHUSDT followed the same path: VCP Forming on 5 October (7.4% → 4.6%, pivot 2,777.33), Box Breakdown on 7 October at 2,559.24. By 30 October BTC had closed at 76,918.91. A VCP describes a shape that often comes before a breakout; it does not promise one.
How to use it in a trade
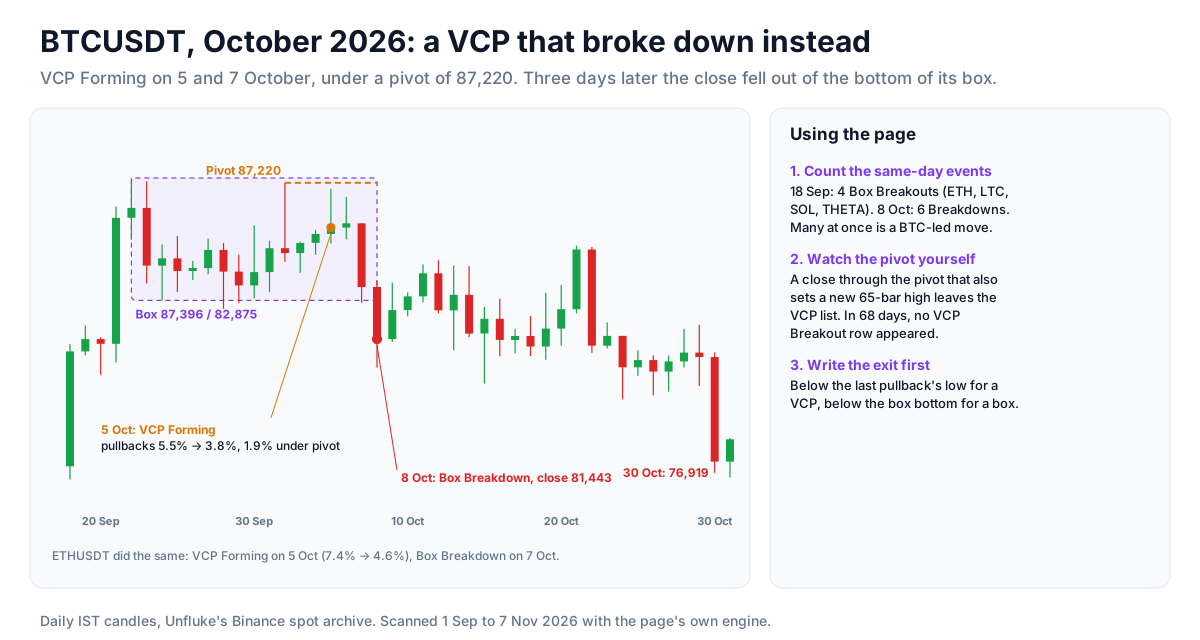
- Count the day's events. On 18 September four pairs broke out of boxes at once; on 8 October six broke down. When many boxes break the same way on the same day, the move is BTC's, and altcoins usually follow it with larger swings. Read BTCUSDT first.
- Shortlist from VCP Forming and In a Box. Sort by the To Trigger column: how far the close is under the pivot or the box top. A pair 1% to 3% away is close to a decision.
- Write the two levels down. The trigger (the pivot or the box top) and the invalidation (the last pullback's low, or the box bottom). For BTC on 5 October they were 87,220 and 82,874.93.
- Set your own alert at the pivot. As explained above, a strong breakout can skip the VCP Breakout tab. The Box Breakout tab and your own alert will catch it.
- Confirm with volume. The page asks for 1.5 times the 50-day average on a VCP breakout. A close through the level on thin volume is weaker evidence.
- Check the next few days. Crypto trades through the night and the weekend. A breakout that falls back inside the box within a day or two has failed, whatever the volume was.
Risk per trade - risk a small, fixed share of capital on any one idea. Crypto never closes, so a stop is the only exit while you sleep; with leverage, keep the liquidation price well beyond the stop. When selling options, prefer defined-risk structures (spreads, iron condors) over naked positions.
Strategy ideas (ideas, not promises)
These are ideas to study, paper-trade and backtest, not recommendations or signals, and not a promise of any result. Every condition below can fail. Crypto trades around the clock and can move sharply at any hour; leverage and options can lose more than you expect, and past behaviour says nothing certain about the next session. Size, entries, exits and risk are your own decisions.
1. Pivot breakout with a stop under the last pullback
- Setup: a VCP Forming pair, 3% or less under its pivot, whose pair also rates 70 or more on the RS page.
- Idea: study a daily close above the pivot on 1.5 times average volume, with the stop under the last pullback's low. The shallower the last pullback, the tighter the stop.
- Invalidation: a close back under the pivot within two days.
2. Box breakouts that agree with BTC
- Setup: a Box Breakout on a day BTCUSDT also closed higher.
- Idea: breakouts with the market behind them, like 18 September, are the cases to collect. Note how often the pair stayed above the box top over the next five days.
3. Breakdowns as exits
- Setup: a pair you hold shows a Box Breakdown.
- Idea: the box bottom is a level the market defended at least three times. Losing it on a close is a natural place to review a long, as BTC on 8 October showed.
Test before you trade - write the rules down exactly, test them on past data (see how to backtest an options strategy and the Option Simulator, which supports crypto), then paper-trade at least 20 occurrences before committing real money. Keep a journal of every trade, including the ones you skipped.
Every tab, filter and column
The tabs
- All - every VCP and box, today's breakouts first, then the closest to their trigger.
- VCP Forming - two or more shrinking pullbacks, volume drying up, close within 10% under the pivot.
- VCP Breakout - close above the pivot today on 1.5 times the 50-day volume (see the note on new highs above).
- In a Box - a confirmed Darvas box, price still inside.
- Box Breakout, Box Breakdown - a close above the top, or below the bottom, today.
The filters
- Date - the newest IST day by default; signed-in users can pick an earlier one.
- Universe - All, Futures or Options.
The columns
- Symbol, LTP - the pair, its close and the day's change.
- Pattern - VCP or Darvas. A pair can have one row of each.
- Status - Forming, Breakout, In box, Breakdown.
- Pivot / Top, Box Bottom - the levels.
- To Trigger - how far the close sits under the pivot or the box top.
- Pullbacks - each VCP pullback's depth, oldest first.
- Box Age - bars since the box top was set.
- Vol Ratio - the day's volume against the average of the 20 days before it.
- 5 Days, Chart - the last five candles, and the chart with the levels drawn.
What the numbers are built from, and what they cannot tell you
- Closes, not intraday breaks. Breakouts and breakdowns are judged on the daily close at 23:59 IST. A move through the level that reverses before midnight does not count.
- Stablecoins. On 6 November 2026 USDCUSDT was listed In a Box 0.44% tall. A box on a coin pinned at $1 means nothing; ignore it.
- One exchange, spot only. The daily bars are rolled up from Unfluke's one-minute Binance spot archive into IST days, 00:00 to 23:59. Perpetual futures volume is not counted.
- Bars, not trading days. Every lookback counts daily bars, and crypto has a bar every day of the week. A "52-week" high is the highest of the last 252 bars, which is about eight months on crypto, not a year; a 200-day average spans about six and a half months.
- Missing days. The archive has no bar for 5 August, 11 September or 5 November 2026. On those dates the pages have nothing to show, and the next day's change is measured from the day before the gap, so it covers two days.
- The newest day can be unfinished. The daily bars are topped up during the day. Until 23:59 IST the day's volume is partial, so fewer pairs pass the 0.8× volume rule in the morning than at night. Signed-in users can pick a finished date.
- End of day only. Nothing here updates within the day from live prices; the scans are recomputed from the daily bars.
Where to go next
The VCP needs Stage 2, explained in the Trend Template & Stages guide; strength against BTC is in the Relative Strength Rating guide; volume behind a breakout in the Volume Shockers guide; and 52-week extremes in the 52-week high and low guide. The NSE version is explained in the VCP & Darvas Box guide. Open the page at Watch List → VCP & Darvas Box (switch the market to Crypto), or sign up free to open the Market Terminal.
More from the blog
- Strategy Backtesting on Unfluke
Backtest trading strategies on real Indian market data with Unfluke. Test equity, Nifty, Bank Nifty and options strategies with realistic costs and key metrics.
- Live Market Scanners
Explore Unfluke's real-time stock scanner for NSE markets. Scan 1,800+ stocks with 40+ technical indicators, fundamental filters, F&O data and custom rules.
- Option Strategy Simulator
Build and simulate multi-leg options strategies with Unfluke. Visualize payoffs, Greeks, max profit and loss, and replay historical option data from 2023.